

BIGNASim database structure and analysis portal for nucleic acids simulation data
Example 5. Combining Experimental and MD analysis
The example shows the information integrated in BIGNASim to compare theoretical results obtained with MD simulations with values obtained from experimental structures/trajectories. Comparison with experimental structures in BIGNASim is done at three different levels:
- Individual helical parameters obtained from the corresponding experimental structure from the PDB
- Averaged analysis of helical parameters from a complete dataset made from available nucleic acids experimental structures from the PDB
- Experimental ensembles with PDB structures of equivalent sequences, analyzed as pseudotrajectories, superimposed to the appropriate analysis
Individual helical parameters obtained from the corresponding experimental structure from the PDB
In those simulations having a reference PDB structure, the most direct analysis are the comparison between geometrical values extracted from the crystallographic structure and those averaged from the simulation trajectory. From the broad range of possible analyses, the helical parameters, and more specificaly, the base-pair step helical parameters are the most used in the last scientific studies (see references section, Ascona B-DNA Consortium articles). In these cases, BIGNASim database store not only the analysis for the simulated trajectory, but also the ones computed on the original PDB structure. Then, just joining both information, a direct comparison can be obtained. The most interesting cases where this comparison can give valuable information are those nucleic acids complexed with protein or ligands. The typical helical conformation of the nucleic acid structure can be distorted due to the influence of the attached molecule. Studying the time-averaged values for a determined simulated trajectory, with its standard deviation, can give a clue about whether the nucleic acid structure explore the conformation needed to accept the docking molecule, or it needs a complete change of shape. Additionaly, docking regions can be easily identified due to the helical parameters distortions shown (e.g. intercalator ligands). To illustrate the procedure, a protein-nucleic acid complex will be chosen. Search section should be used to select the corresponding feature from the Ontology section, System Type → Complex: Protein-Nuc. See previous examples to see uses of the search engine.

From the results obtained, NAFlex_1hlv will be selected to explore it further.

The upper part of the simulation page for the NAFlex_1hlv shows information about the simulated system. It can be seen that the simulation was done with just the nucleic acid portion of the complex, otherwise the picture would contain the whole complex. This will be more evident when we look at the helical parameters comparison with the experimental values, which correspond to the complexed conformation.

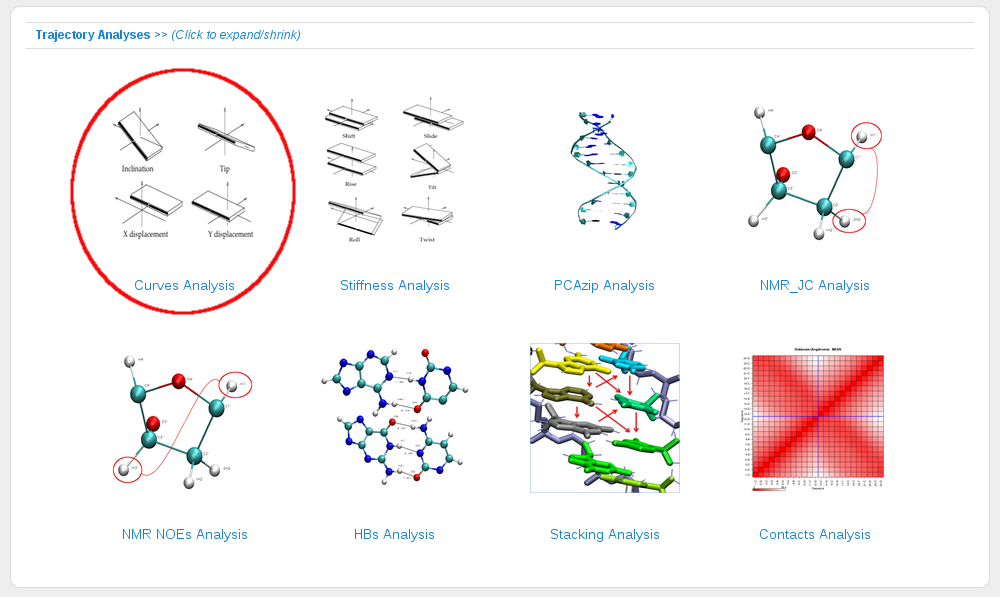
Trajectory Analyses → Curves gives the set of pre-computed helical analyses available.
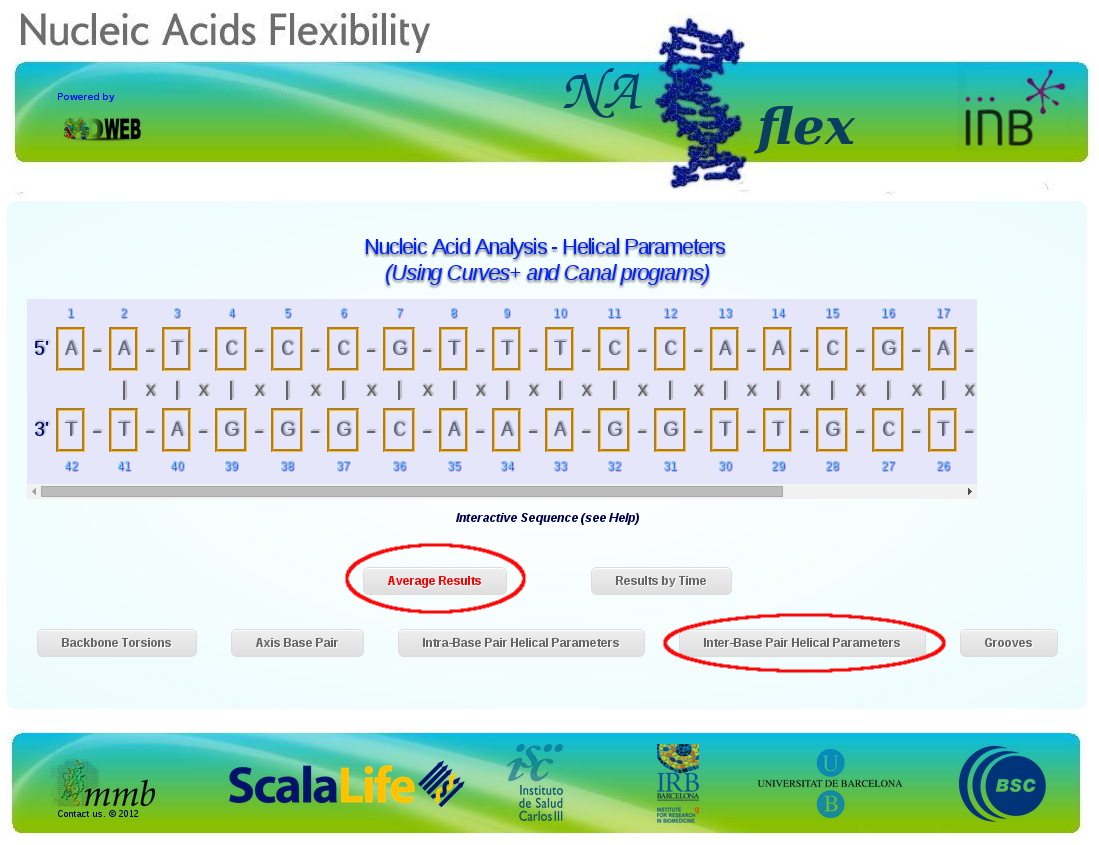
This will open the extended NAFlex interface included in BIGNASim. For a complete description of NAFlex analysis interface and its interactive sequence possibilites, please refer to NAFlex help pages (1). Average Results and Inter-Base Pair Helical Parameters should be selected.
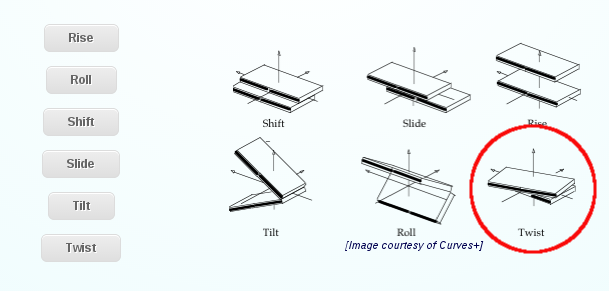
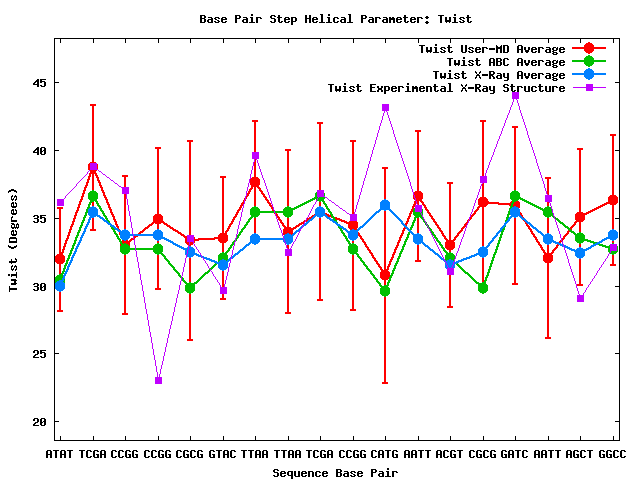
This will show a set of six different inter-base pair step helical parameters: Rise, Roll, Shift, Slide, Tilt and Twist. Each of them have an associated plot with the comparison between the time-averaged theoretical results with the experimental ones. As example the figure below shows results of the Twist parameter along the sequence. Four lines with different colours are shown: NAFlex_1hlv theoretical MD simulation in red, with standard deviation values; average values coming from a set of MD simulations (green) and X-ray structures (blue) (11) and finally the values computed to the corresponding 1HLV PDB experimental structure in violet. One can easily identify the regions of the nucleic acid where the protein is attached, disturbing the helical conformation. The same analysis can be obtained for the rest of base-pair parameters.
 Go to Top of the Page
Averaged analysis of helical parameters from a complete dataset made from available nucleic acids experimental structures from the PDB
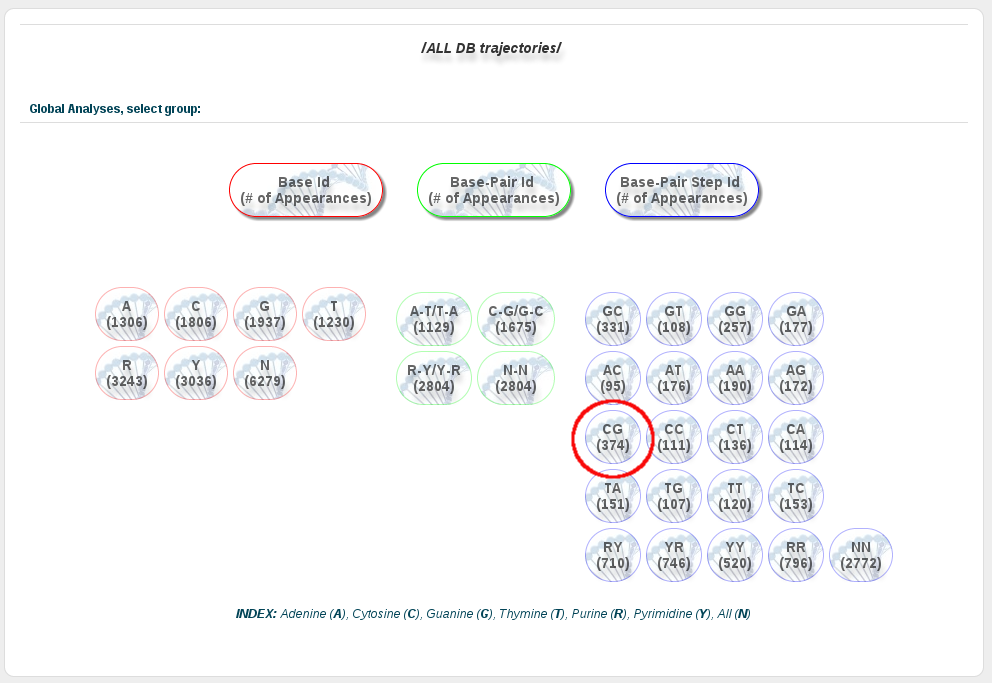
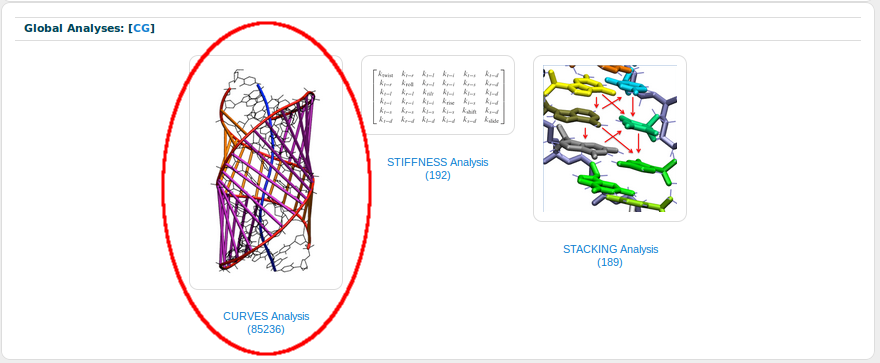
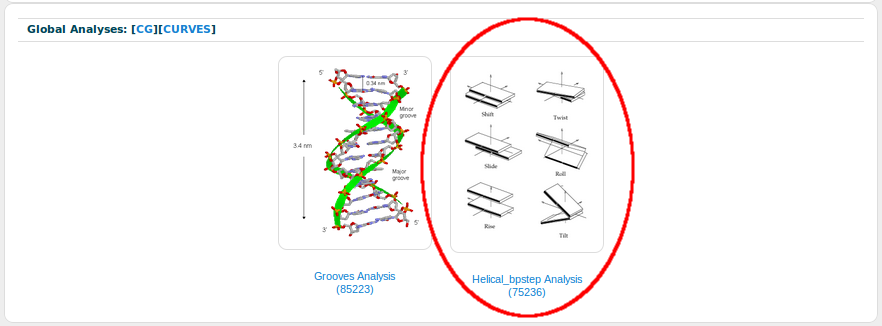
The second way BIGNASim offers to compare theoretical and experimental values covers a more global vision of nucleic acids flexibility. For that, an averaged analysis of standard fragments (base, base pairs, and base-pairs steps) of a complete dataset made from available nucleic acids experimental structures (taken directly from the PDB), is included in global analyses. See BIGNASim corresponding help section for details of the pipeline to obtain such structures. These averaged values can be used to compare global values extracted from the database having information from many different simulations on a single base, base pair, and base-pairs step and thus obtain a direct representation of how much our simulations reproduce the experimental observations. To illustrate how this information is added in the BIGNASim interface, the set of global analyses for the CG base-pair step will be used, but any other fragment can be analysed likewise. The procedure required is Global analyses → CG → Curves → Helical_bpstep → Roll
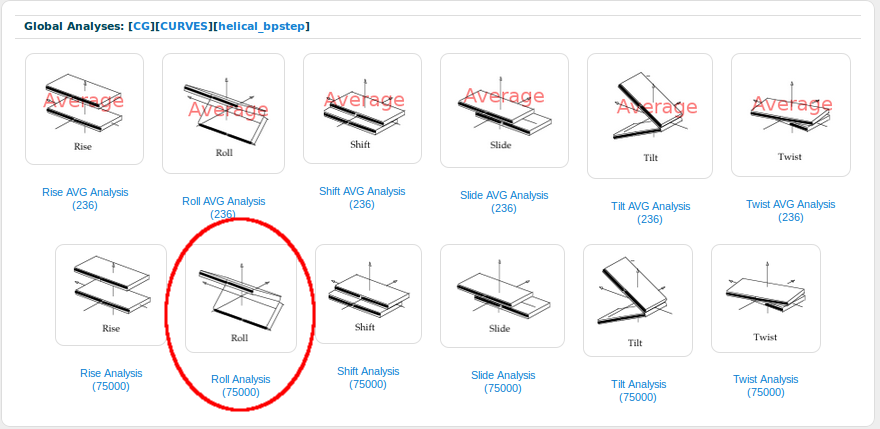
BIGNASim automatically generates a histogram with all the Roll values extracted from the database. Two vertical lines are plotted on the histogram: a blue one, indicating the mean for the represented set of values (MDs) and a red one, which corresponds to the experimental average value obtained from experimental structures.
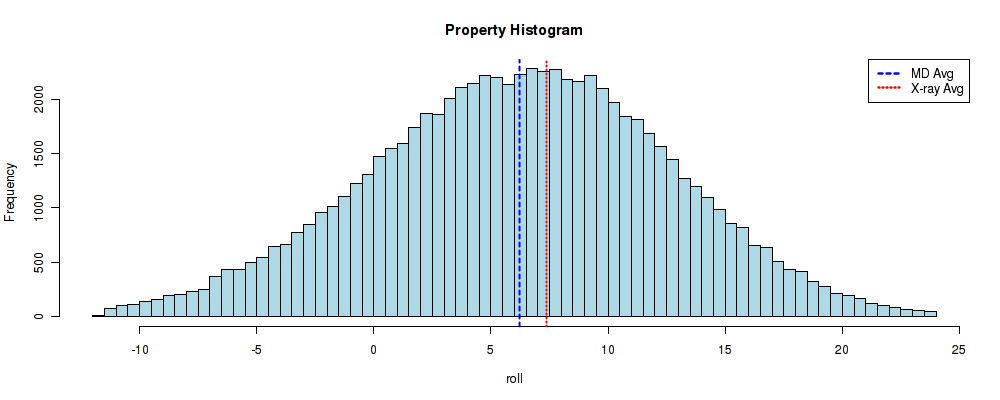
In this case it can be easily seen that the observed values from the simulated systems agree pretty well with the experimental average. The distribution of values follows an almost perfect normal distribution, with the mean value (6.225) distant just 0.5 degrees from the experimental average value (7.35). A second base-pair step parameter, Twist, show a different behaviour. It is known from reference (11) that CG-Twist show bimodality with a polymorphism between a high twist (~20º) and a low twist (~40º).
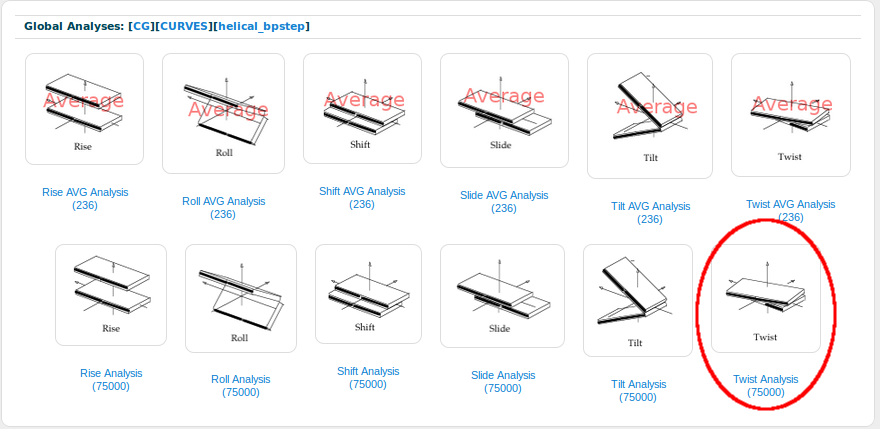
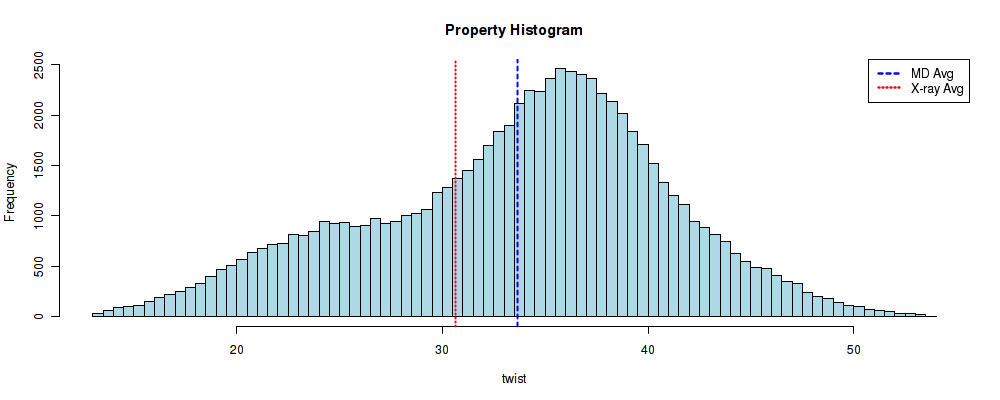
The difference with the previous Roll distribution is clear. In this case, two different distributions can be easily identified, centered at ~25º and ~35º. Interestingly, although the theoretical mean value (33.64) is close to the experimental one (30.66), both averages hide information about the bimodality.
Go to Top of the Page
Experimental ensembles with PDB structures of equivalent sequences, analyzed as pseudotrajectories, superimposed to the appropriate analysis
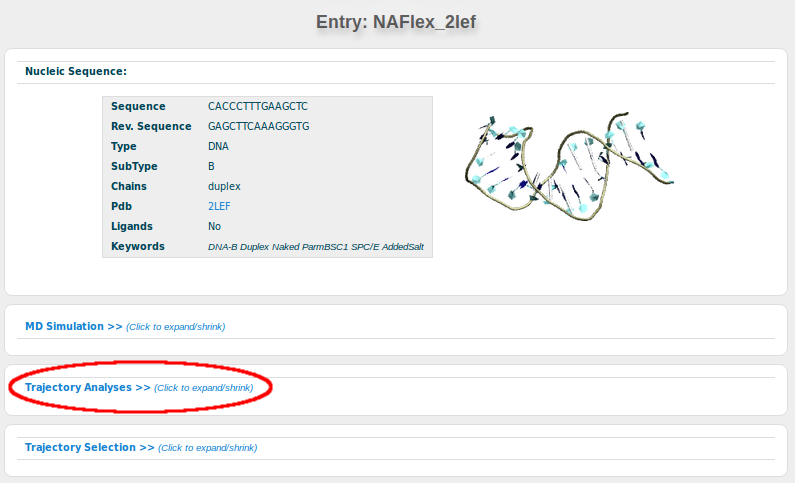
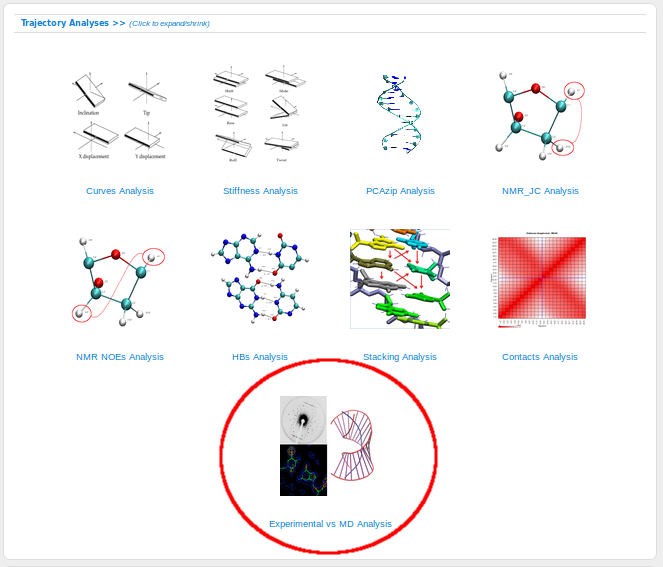
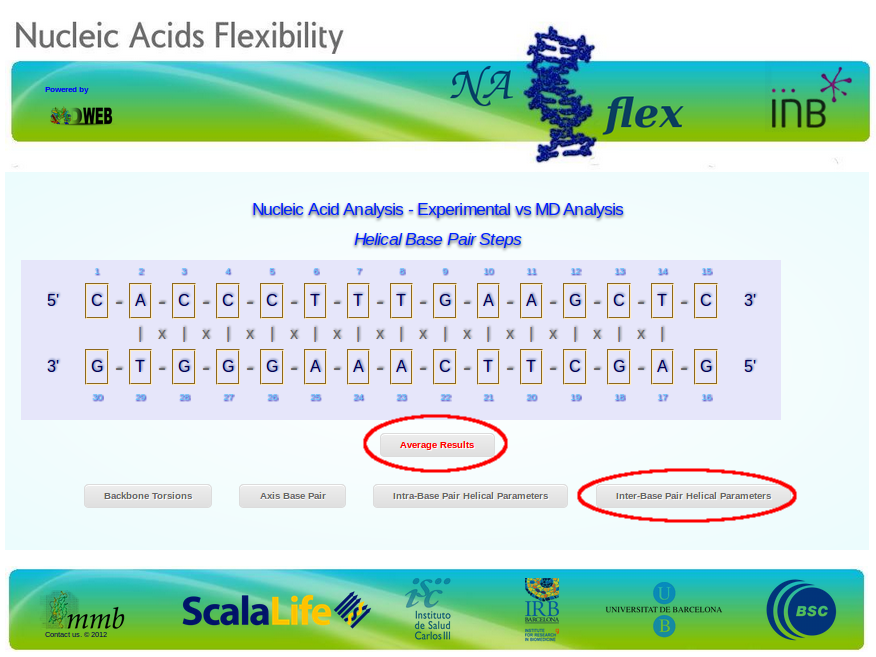
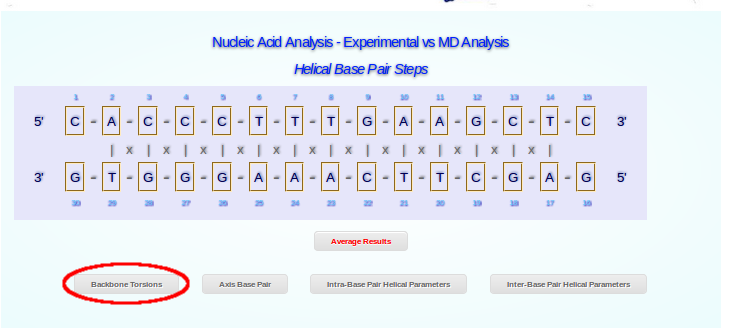
The last experimental comparison in BIGNASim is done using analysis taken from experimental ensembles. The procedure to build such ensembles can be found in BIGNASim experimental trajectories help section. Having these experimental ensembles allows to compare theoretical values not just against experimental static information but also the ensemble conformation found in experimental data. If a particular helical parameter exists in two different conformations (see previous section, CG-Twist example), that information can be obtained from the experimental ensemble and, thus, be compared with our MD simulation values. Unfortunately, due to the scarce number of deposited PDB structures for a determined nucleotide sequence, the number of generated experimental trajectories goes just up to 15 different ensembles (see experimental trajectories table). In this example, a particular structure will be used: a protein-DNA complex with PDB Code 2LEF, the structure of a Lymphoid Enhancer-Binding Factor (Lef1 hmg domain, from mouse), complexed with DNA (15bp). As the deposited structure in the PDB was obtained by Nuclear Magnetic Resonance (NMR), it contains 12 different structures, what allows us to construct the experimental ensemble and compute the corresponding helical parameters. The simulation can be easily found from the search section (Searh by Ontology → System Type → Complex: Protein-Nuc), and using its nucleotide sequence (CACCCTTTGAAGCTC) in the Search by Sequence section, or just browsing the whole database and ordering the results by the id. Once in the simulation page, the Trajectory Analyses show a specific section about comparison experiment when this is available:
The path to obtain the compared analysis is "Average Results → Inter-BasePair Helical Parameters".
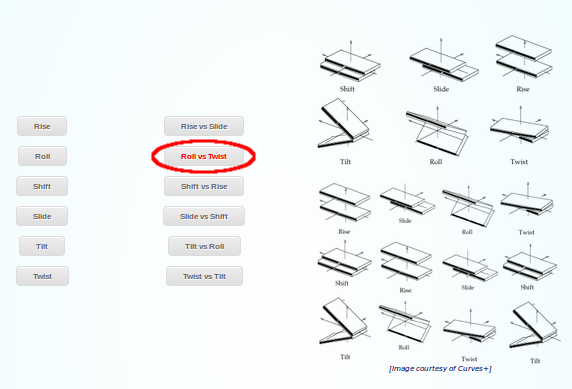
Please note that direct access to this NAFlex interface for all the sequences having a calculated experimental trajectory is also available in the Experimental Trajectories help section. As this text is intended to be a tutorial, all the previous steps to get to this point are detailed. Two examples will be described: one single parameter (Roll), or two parameters (Roll and Twist).
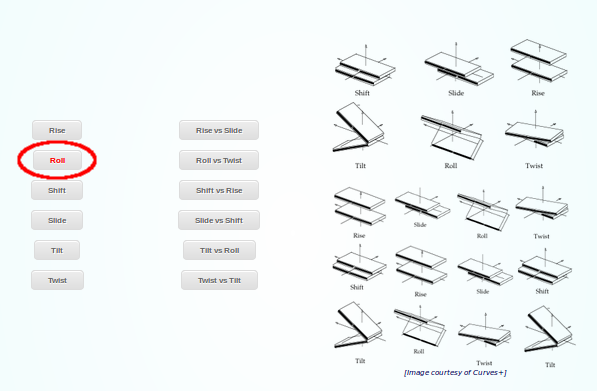
This is the resulting Roll plot:
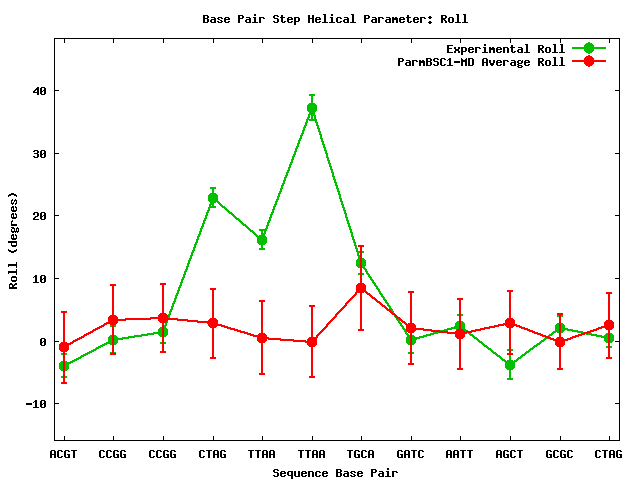
The plot shows two lines representing time-averaged values for the Roll parameter: red line corresponds to the MD simulation and green line corresponds to the experimental ensemble. It can be clearly identified a distorted region of the DNA, from the 4th to the 6th base-pair steps of the sequence, probably influenced by the attached protein. The available MD simulation (naked B-DNA) is not exploring these specific Roll values, so the experimental behaviour of the nucleic acid is in this case cleary influenced by the protein. The Roll and Twist example can be followed in a similar way.
Analyses of helical parameters pairs are done for each of the base-pair steps present in the sequence. In this case, we have 6 different plots, corresponding to (AA/TT, AC, AG, CC/GG, CT, GA, GC and TG).
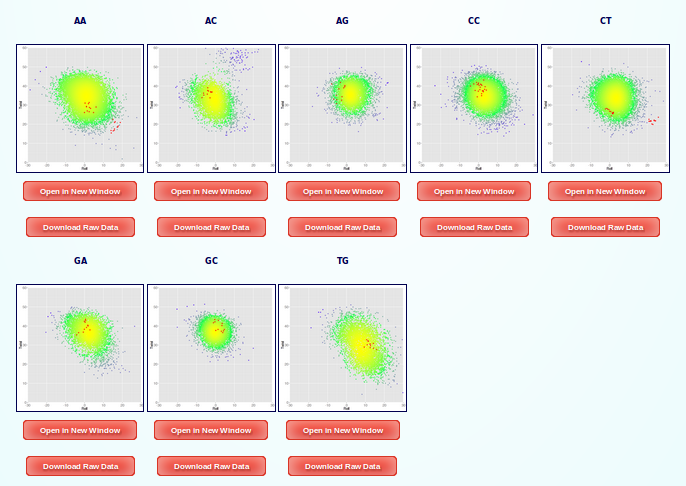
The following figure shows the base-pair step AA (TT) Twist vs Roll in more detail:
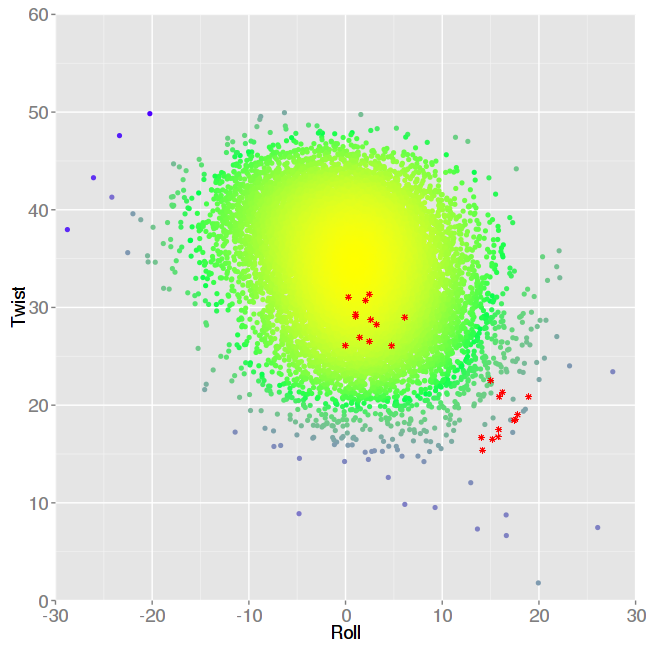
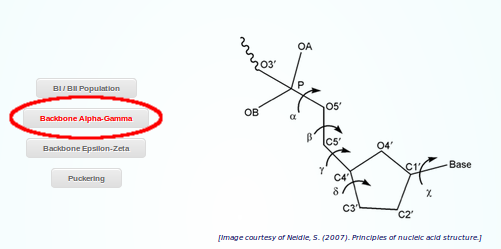
Information shown in these 3D plots are points corresponding to the correlation between both parameters, where colours represent different population densities, from higher density in yellow, to lower density in blue. Experimental values are shown as asterisks symbols in red colour. As expected from the results found in the previous Roll plot, there is a strong deviation in the Roll parameter for some of the base-pair steps, placed in a region of the plot almost unexplored by the complete MD simulation. Unsurprisingly, they also have distorted values of the Twist parameter. But comparisons are made also for backbone torsions, axis base pairs and intra-base pair helical parameters. As a last example, the following screenshots show a similar example with Backbone Torsions:
There are 4 different analyses available: BI/BII population and Puckering percentages, and two angle analysis: α/γ ε/ζ. We choose Backbone α/γ analysis:
The resulting plot shows the MD (black) vs the experimental (red) values:
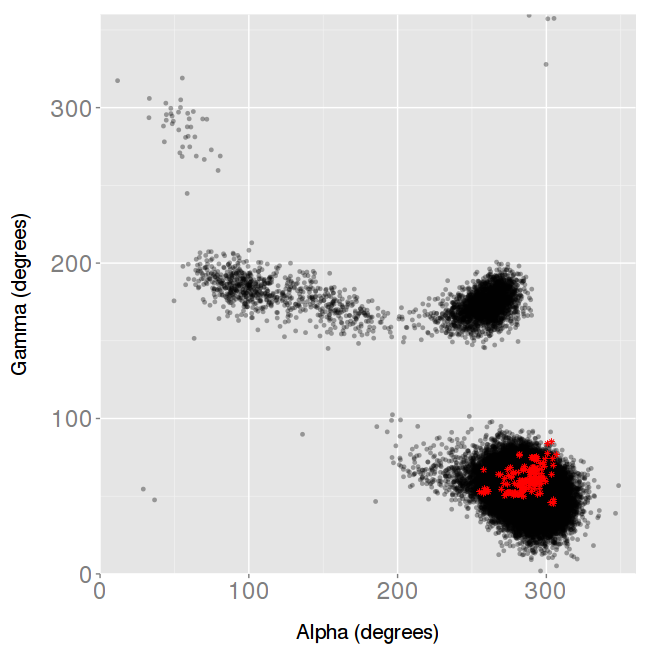
No distortion is observed in this case, with the experimental ensemble exploring just a single conformation, whereas the MD simulation is exploring different well-known regions of the conformational space.
Go to Top of the Page