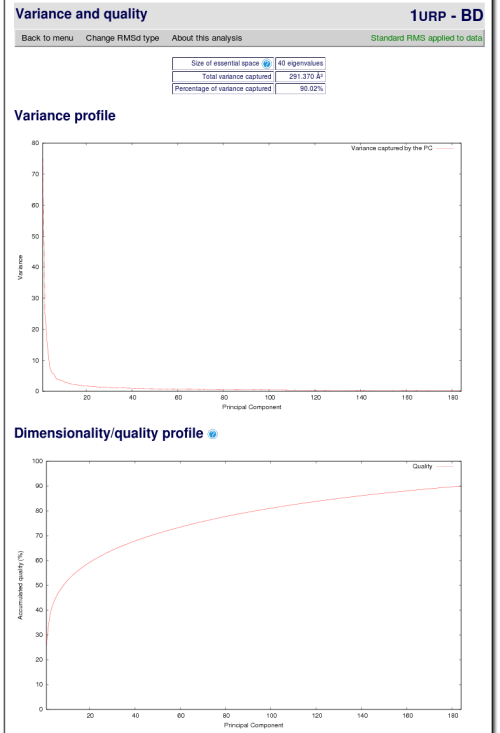
The first graph shows the total variance of the trajectory and how it is distributed along the different eigenvectors. Variance appears in Ų and eingenvectors are shown according to eigenvalues descending order, the first one being the most important one and the last that with the lower contribution to variance. This graph indicates the size of the flexibility space (higher the variance higher the flexibility) and how it is distributed in different modes.
The second graphic shows the percentage of explained variance for a given number of eigenvectors (quality) and the dimensionality of the sampled space. This graph indicates the complexity of the flexibility space, i.e. how many modes are necessary to explain the entire flexibility of the protein. Note that Graphs 1 and 2 provide physically-different information and that proteins might display a very complex pattern of flexibility (leading to large dimensionality) and at the same time be quite rigid (low variance), or have a large variance which can be fully explained by a very small number of modes.