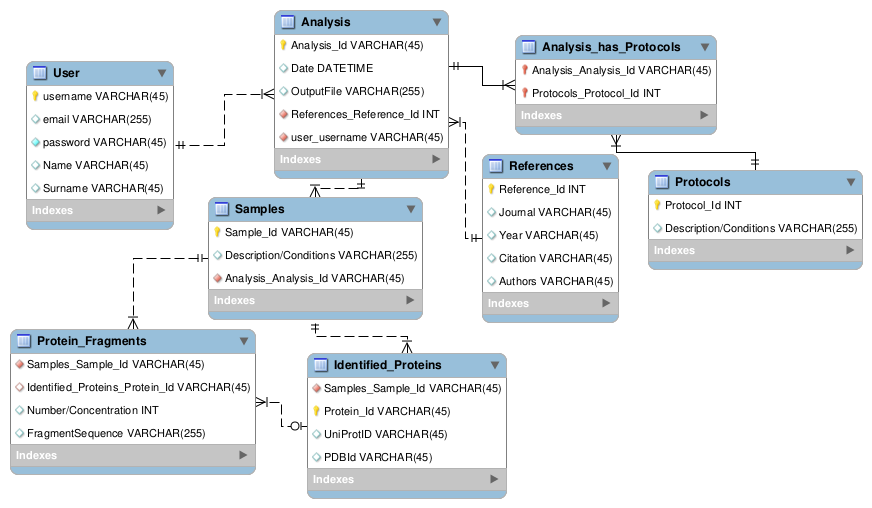
The following image displays the data model for the Proteomics experiment:
I selected 7 tables for this model:
-
The first one is the user table with the different attributes for the users of our service.
This table has a 1:N relationship with the analysis table, as 1 user has N analysis.
-
The second one is the references table, that has the attributes for the references of the analysis.
Each reference can have N analysis associated, so it has a 1:N relationship with analysis.
-
The next is the protocols table, which has a description attribute and also is in a N:N
relationship with the analysis, as one analysis can use multiple protocols but also one
protocol can be used for multiple analysis.
-
The fourth one, is the analysis table itself, with the attributes of Date and Outputfile (with
the path to the raw results). It has a 1:N relationship to the samples table, as more than 1 sample
can be in an analysis.
-
Next, we have the sample table, with a description attribute (referring to the sample conditions) and two 1:N relationships,
corresponding to the protein fragments table and the proteins identified table.
-
These last two tables have attributes corresponding to number and sequence, and ids respectively. They also share a relationship, in which
N fragments can be identified into 1 protein, but the fragments can also remain unidentified, if they dont match to an existing PDB or Uniprot Id.