FlexServ is written in PHP and implemented as a web-based interface, acting as a front-end of a series of simulation and analysis modules. In our current implementation, FlexServ runs on Apache 2 server. A batch system allows the program to direct heavy calculations to a large cluster. Results are presented through the this web interface or, alternatively, when longer simulations are involved, results are then stored in the server and can be retrieved later using a unique key sent by email. This results will be stored in the server for 7 days. The application modules are also available as a series of web services within the Spanish National Institute of Bioinformatics platform (https://www.inab.org).
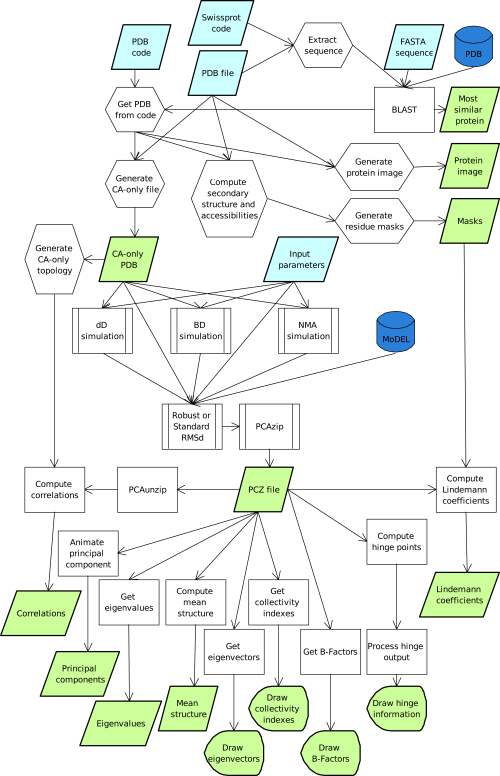
The user can upload or type a coordinate file (pdb-format), retrieve the structure using a just the PDB code, or upload his/her trajectory as a PCZ compressed file (Meyer et al., 2006), the required pcazip software can be downloaded here. Users can also upload the protein sequence, either in FASTA format or using a UniprotKB code. In this later case, analysis is perfomed on the closest homologue available in the PDB, identified by a standard BLAST analysis. Additionally, the program allows the user to search for atomistic results in the MoDEL database using just the PDB identifier. Currently, except for NMA, analysis can only be performed for one protein chain. If no chain is specified, the first chain found in the structure is used.
Once the structure is loaded, the program computes several protein descriptors and performs basic visualization. It also generates a Cα model and offers the possibility of choosing between the available engines to generate protein flexibility (Figure 1): i) Normal mode analysis (NMA), ii) Brownian dynamics (BD) and iii) Discrete dynamics (DMD). In an elastic NMA calculation the Hessian (defined with any of the three force-field options available) is computed and diagonalized to obtain the eigenvectors and eigenvalues, which can then be used to derive a Monte-Carlo pseudo-trajectory (see above) in the NMA space. In the case of BD or DMD, trajectories are directly obtained using the respective force-fields. Irrespective of the source, the trajectories are processed with the pcazip module (Meyer, et al., 2006), where a RMSd and gRMSd fit are applied to the data, which is finally compressed. For uploaded or MoDEL simulations, the compressed trajectory is processed directly.
The PCAZIP format contains the eigenvectors/eigenvalues files which can be used to animate the movement of the protein along individual eigenvectors (essential dynamics modes) as well as to derive metrics such as: the collectivity index, the B-factor analysis (global and per mode), Lindemann’s coefficients, apparent inter-residue stiffness and hinge point location. Finally, raw trajectories are used to perform correlation analysis (see above).
Visulatization modules are responsible for presenting the results to the user. Data is presented as plain text, or 2D plots When appropriated, 3D data is presented using a JMol applet that allows the user to control the visualization. The produced trajectories and raw analysis data can be downloaded from the server for further processing.