Bioactive Conformational Ensemble Help - Subsets QM
QM
The QM tab presents the QM-refined conformations, together with energies with respect to the bioactive conformation (if available). The section is divided in 2 sub-sections, which can be selected in the top-right corner of the window:
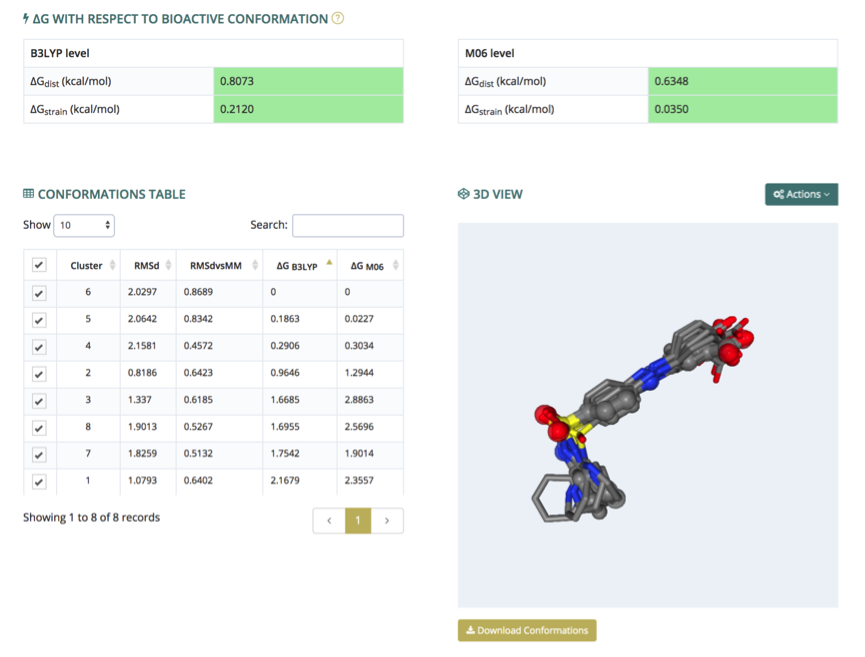
Energies
The energies section presents, in a similar way to the Cluster Analysis, the 3D structures of each of the QM-refined conformers, plus the experimental one (if available). The structures are rendered in an NGL interactive widget (3D view, right), where each conformer can be shown, hidden or compared with the others. Conformers to be represented are selected in the conformations table (left), which also contains associated information such as RMSd with respect to the experimental structure (if available) or with respect to the corresponding conformation coming from the MD simulation (not optimized at a QM level). The table also contains a couple of ΔG (free) energies as determined from DFT/SCRF calculations at two different theory levels (B3LYP, M06), taking the most stable conformation as reference. When the bioactive conformation is known, the strain and distortion free energies obtained from the QM energies (see references) are shown (ΔG with respect to bioactive conformation, top).
The visualization window allows three different structure alignments: by heavy atoms, by biggest rings, and by Gaussian RMSd. Hydrogen atoms and experimental structure (if available) can be shown and hidden through a switch key. All these controllers are displayed from the top-right Actions button. Finally, the complete set of conformations can be downloaded, in multi-PDB format, from the Download Conformations button (bottom right).
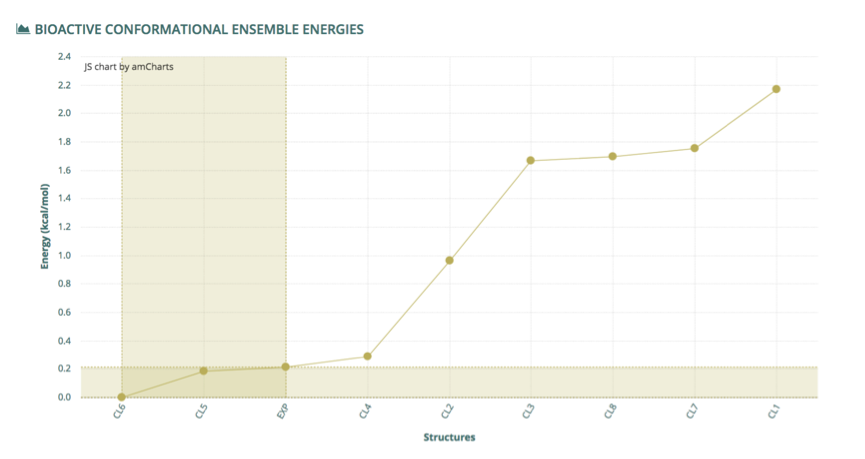
Finally, the Bioactive Conformational Ensemble Energies chart at the bottom of the page displays the ΔG free energy (B3LYP, Kcal/mol) for all conformations from the final set, ordered from 0 to the maximum energy found. Energy of the experimental structure is included (when available) as a reference, and the region containing conformers found having lower (better) energy than the experimental structure is highlighted.
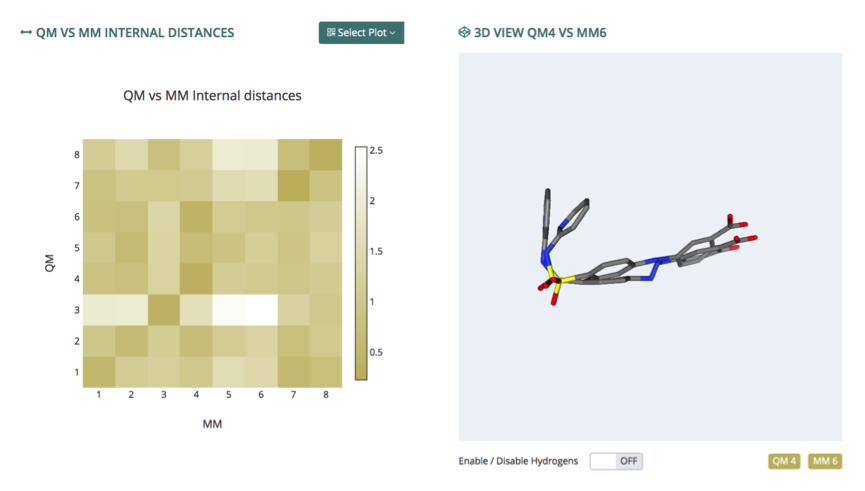
Distances
The distances section presents a complete study of the structural differences between the different conformers found from the simulation (CL vs CL) and between the same conformers and their QM-optimized conformation (QM vs MM). Three different metrics were used to compute structural similarities: standard Cartesian RMSd, RMSd by internal distances (RMSdi), and Cartesian RMSd taking symmetries into account. For each of these combinations, available from the Select Plot button (top), a heatmap distance matrix is offered, with a color gradient going from white (no similarity) to dark brown (same structure). Values obtained can be seen aiming the mouse pointer to one particular cell. Clicking at any of these cells in the matrix will trigger the representation of the particular pair of structures in the associated NGL viewer (right), which allows to show/hide the hydrogen atoms and also the individual structures represented, for clarity.