
NAFlex Nucleic Acids Flexibility Analysis
Analysis offered by NAFlex for Nucleic Acid structures can be divided in seven main fields:
- Helical Parameters
- Principal Components
- Nuclear Magnetic Resonance Observables
- Base Pair Canonical Hydrogen Bonds
- Atom Pairs Distances
- HB/Stacking Energies
- Distance Contact Maps
NAFlex Nucleic Acids Flexibility Analysis: Helical Parameters
Using Curves+, NAFlex offers a complete study of Nucleic Acids Helical Parameters:
Backbone Torsions
The three major elements of flexibility in the backbone are:
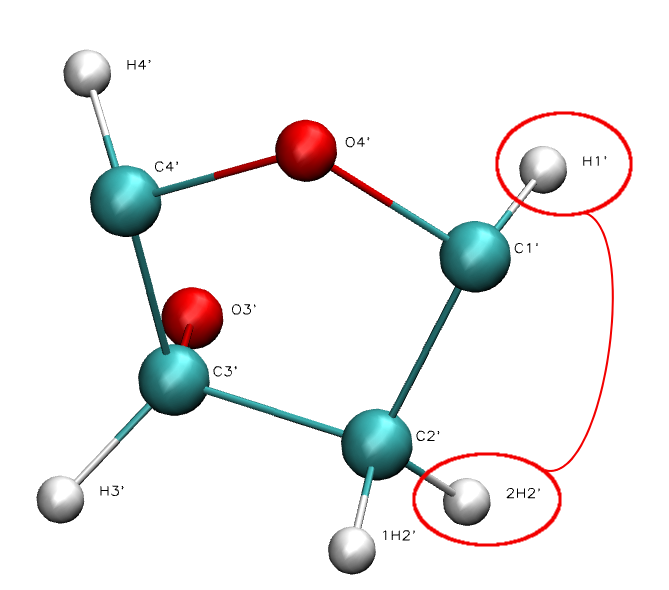
- Sugar Puckering
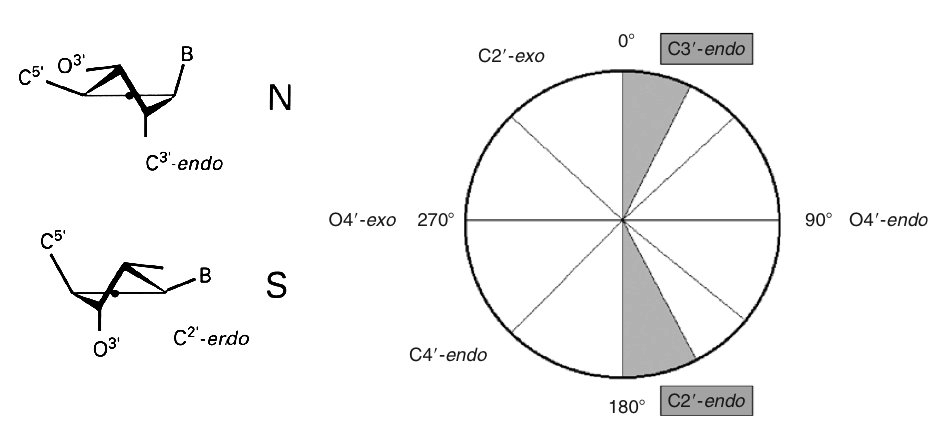 Sugar Puckering annotation is done by dividing the pseudo-rotational circle in four equivalent sections:
- North: 315:45º
- East: 45:135º
- South: 135:225º
- West: 225:315º
- Canonical Alpha-Gamma
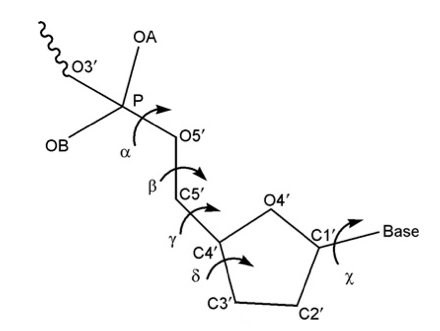
Rotations around α/γ torsions generate non-canonical local conformations leading to a reduced twist and they have been reported as being important in the formation of several protein-DNA complexes.
- BI-BII Population
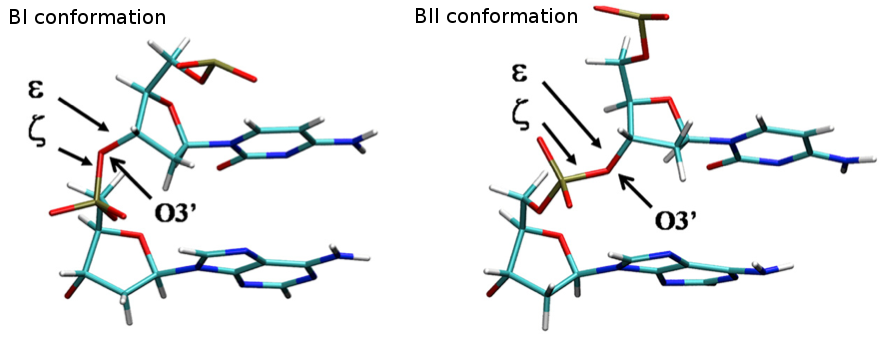
The concerted rotation around ζ/ε torsions generates two major conformers: BI and BII, which are experimentally known to co-exist in a ratio around 80%:20% (BI:BII) in B-DNA.
Axis Base Pairs

Translational (x/y-displacement) and rotational (inclination, tip) parameters related to a dinucleotide Base Pair.
- X-displacement: Translation around the X-axis.
- Y-displacement: Translation around the Y-axis.
- Inclination: Rotation around the X-axis.
- Tip: Rotation around the Y-axis.
Intra-Base Pairs
 Translational (Shear, Stretch, Stagger) and rotational (Buckle, Propeller, Opening) parameters related to a dinucleotide Intra-Base Pair.
- Shear: Translation around the X-axis.
- Stretch: Translation around the Y-axis.
- Stagger: Translation around the Z-axis.
- Buckle: Rotation around the X-axis.
- Propeller: Rotation around the Y-axis.
- Opening: Rotation around the Z-axis.
Inter-Base Pairs
 Translational (Shift, Slide, Rise) and rotational (Tilt, Roll, Twist) parameters related to a dinucleotide Inter-Base Pair (Base Pair Step).
- Shift: Translation around the X-axis.
- Slide: Translation around the Y-axis.
- Rise: Translation around the Z-axis.
- Tilt: Rotation around the X-axis.
- Roll: Rotation around the Y-axis.
- Twist: Rotation around the Z-axis.
Grooves
 Nucleic Acid Structure's strand backbones appear closer together on one side of the helix than on the other. This creates a Major groove (where backbones are far apart) and a Minor groove (where backbones are close together). Depth and width of these grooves can be mesured giving information about the different conformations that the nucleic acid structure can achieve.
- Major Groove Width.
- Major Groove Depth.
- Minor Groove Width.
- Minor Groove Depth.
Stiffness
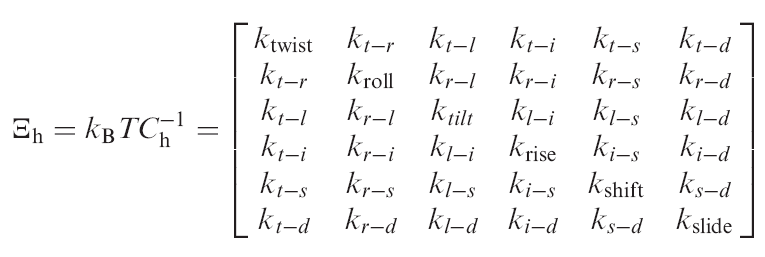 Elastic force constants associated with helical deformation at the base pair step level were determined by inversion of the covariance
matrix in helical space, which yields stiffness matrices whose diagonal elements provide the stiffness constants associated with pure
rotational (twist, roll and tilt) and translational (rise, shift and slide) deformations within the given step.
Elastic force constants associated with helical deformation at the base pair step level were determined by inversion of the covariance
matrix in helical space, which yields stiffness matrices whose diagonal elements provide the stiffness constants associated with pure
rotational (twist, roll and tilt) and translational (rise, shift and slide) deformations within the given step.
NAFlex Nucleic Acids Flexibility Analysis: Principal Components
 Following Essential Dynamics algorithm (ED), the orthogonal movements describing the variance of a system trajectory is obtained by diagonalization of the covariance matrix.
The result of the analysis is the generation of a set of eigenvectors (the modes or the principal components), which describe the nature of the deformation movements of the protein and a set of eigenvalues, which indicate the stiffness associated to every mode.
The eigenvectors appear ranked after a principal component analysis, the first one is that explaining the largest part of the variance (as indicated by the associated eigenvalue). Since the eigenvectors represent a full-basis set the original Cartesian trajectory can be always projected into the eigenvectors space, without lost of information.
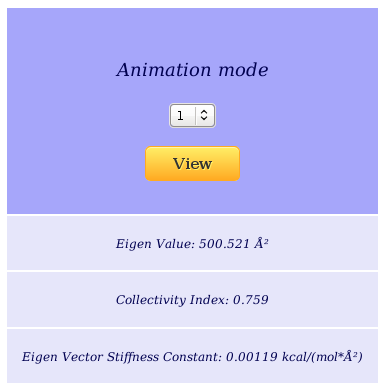
Each of the eigenvector obtained from Principal Component Analysis of a trajectory is called a Principal Component. The associated eigenvalue indicates the amount of variance explained by the component. The Collectivity Index gives a measure of how many atoms of the protein are affected by a Principal Component.
NAFlex uses PCAsuite package to compute Principal Components Flexibility Analysis. PCA is computed using all the atoms of the structure and the compression is reduced to a 90% of the explained variance. Only the first 10 principal components are shown in the graphical interface, as the first modes are usually the ones explaining the largest part of the variance.
NAFlex Nucleic Acids Flexibility Analysis: Nuclear Magnetic Resonance Observables
Nuclear magnetic resonance spectroscopy (NMR) is a technique that exploits the intrinsic magnetic properties of certain atomic nuclei to determine physical and chemical properties of their environment. NMR can provide detailed information about the structure, dynamics, reaction state, and chemical environment of all kind of molecules, including very complex ones such as nucleic acids and proteins.
J-Couplings
Vicinal 1H-1H Coupling Constants (3J-Couplings) are scalar couplings between protons located three bonds away (H-C-C-H).
Vicinal J-Couplings are empirically correlated with the dihedral angle (H-C-C-H) through the so-called Karplus equation.
NOEs
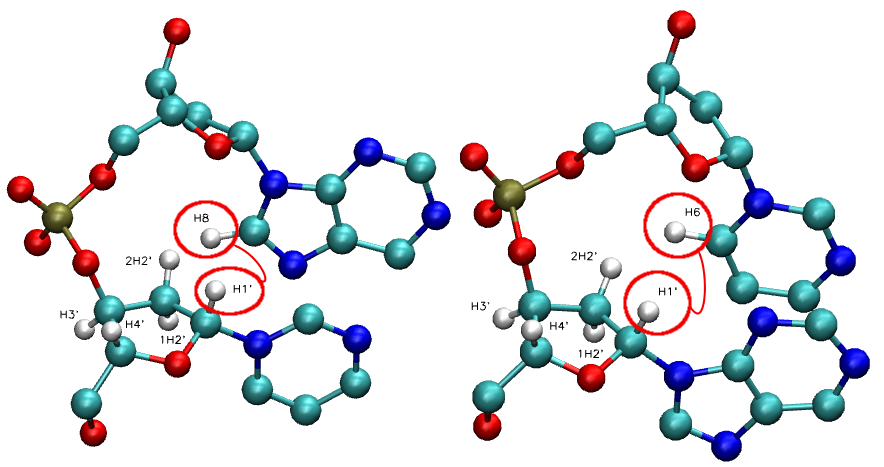
Nuclear Overhauser Effect is the transfer of magnetization from one nuclear spin to another via cross-relaxation. The intensity of NOE cross-peaks between two particular protons depends on their relative distance ( Inoe = 1/d6 ).
Proton-proton distances derived from NOEs are the most useful NMR parameters for structure elucidation.
NAFlex Nucleic Acids Flexibility Analysis: Base Pair Canonical Hydrogen Bonds
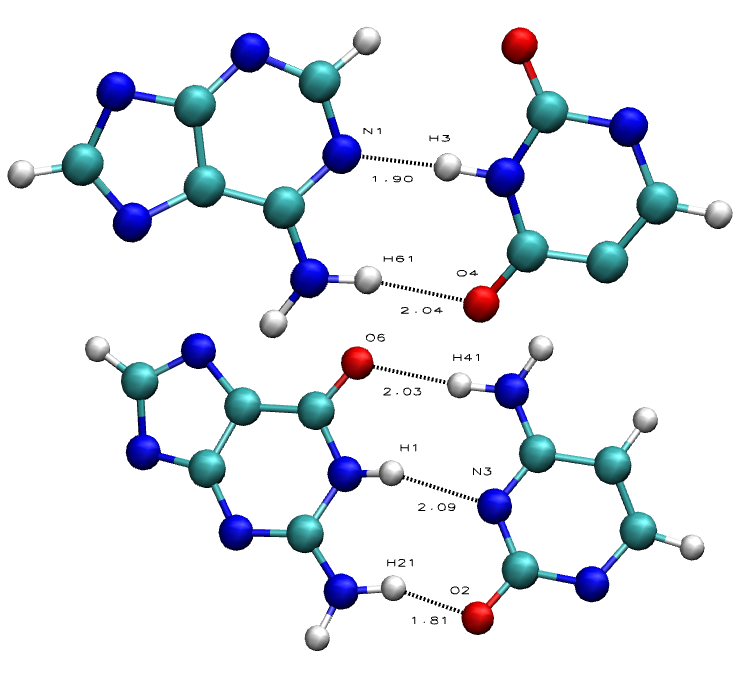
Hydrogen Bonds in nucleic acid base pairs contribute to the overall stability of the DNA/RNA double helix structure. This double helix is very stable, and that's partly due to the base pair hydrogen bond interactions between bases in one strand to the complementary bases in the other strand: Purines (Adenine, Guanine) with Pyrimidines (Cytosine, Thymine, Uracil).
Guanine-Cytosine base pairs can form 3 hydrogen bond interactions, while Adenine-Thymine/Uracil can only form 2, thus making nucleic acid with more GC base pairs more stable than nucleic acid with more AT base pairs..
NAFlex Nucleic Acids Flexibility Analysis: Atom Pairs Distances
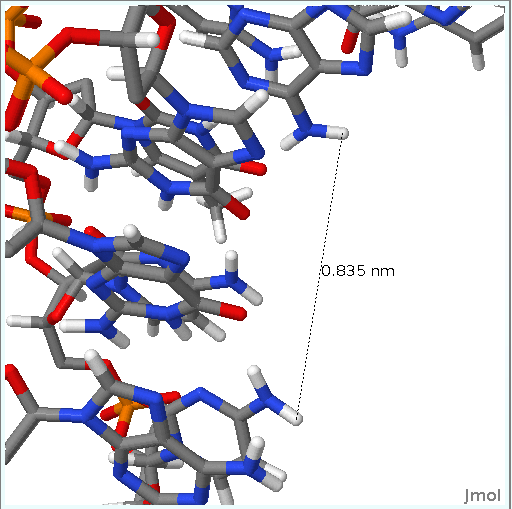
Apart from the Canonical Hydrogen Bond distances, sometimes it is interesting to follow the distances between different atom pairs.
This information can give clues about the flexibility part of a nucleic acid structure and the movements that it undergoes during the dynamic simulation.
NAFlex Nucleic Acids Flexibility Analysis: HB/Stacking Energies
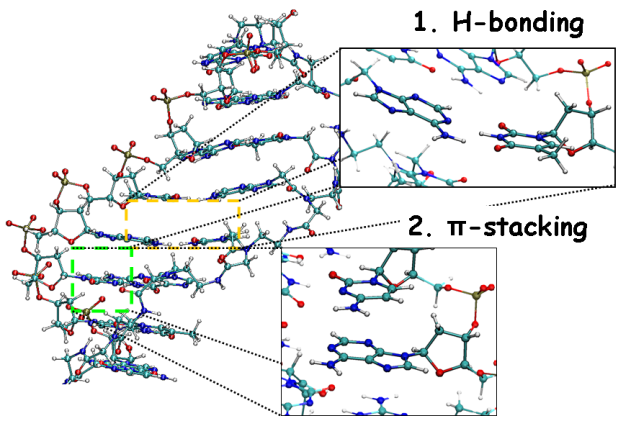 Interaction energies between Hydrogen-Bonded Base Pairs (HB energies) and attractive, non-covalent interactions between aromatic rings in consecutive bases (Stacking energies) are two of the most useful analysis in DNA/RNA molecules.
Stacking energies can be computed between consecutive bases and also between bases of different strands.
Hydrogen Bond energies are known to be greater in G-C base pairs than in A-T base pairs.
Analysis results are commonly plotted as contact maps where nucleotide pairs are easy to identify.
NAFlex Nucleic Acids Flexibility Analysis: Distance Contact Maps
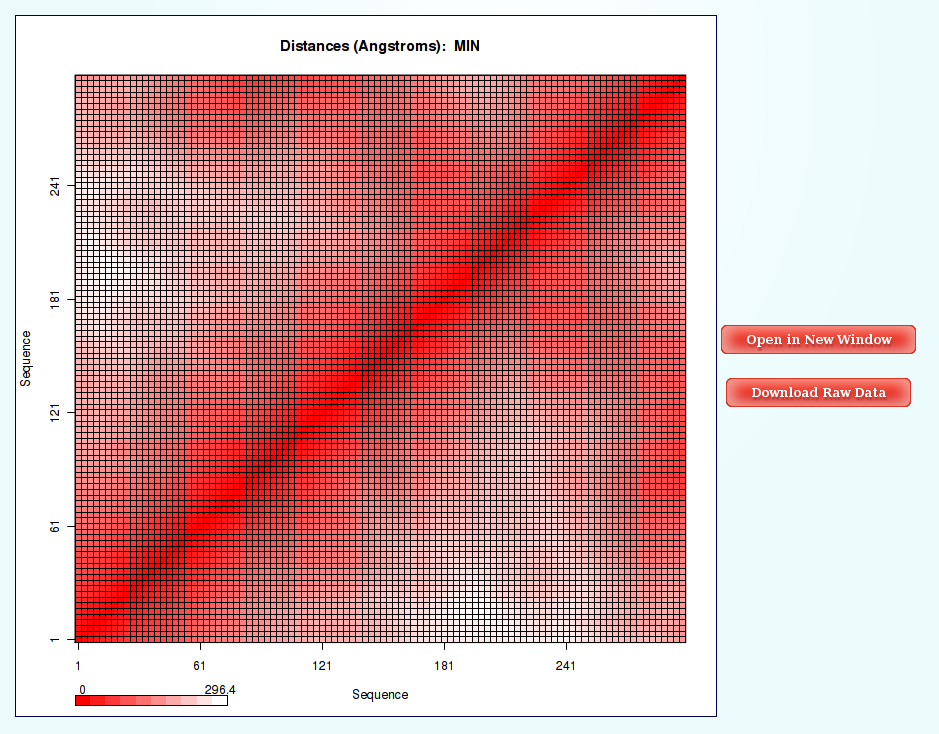
Information as the distances (for example distance mean or minimum distance) between all the pair of bases in a nucleic structure during a dynamic simulation can be very useful to obtain a picture of the flexibility of the structure and the movements that it undergoes during the dynamic simulation.
The most common way to look a this information is plotting it with Contact Maps. With these plots, a square is painted for every nucleotide pair, assigning a color depending on the value of the analysis (distance in this case). Usually, high values out of the diagonal (closest nucleotide pairs) are the most interesting and informative ones.