Workspace
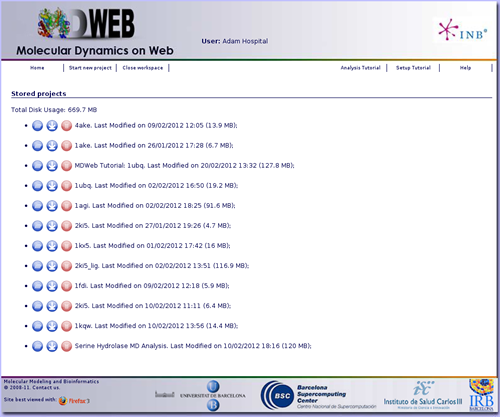
Users in MDWeb have their own workspace.
User workspace appears just after login. In the workspace, all projects user's projects are shown. Name of the project, last modification date and disk usage is displayed.
This page acts as a project repository. Users can identify a specific project to open,
remove it from the workspace (note that this implies erasing all data included in the project) or download it.
Projects downloaded will be given in a single compressed file, that can be stored by MDWeb users and can be uploaded again from MDWeb start project page at a later time. This will help to save disk space and in the case of non-registered users to resume their projects in further sessions.
Structures
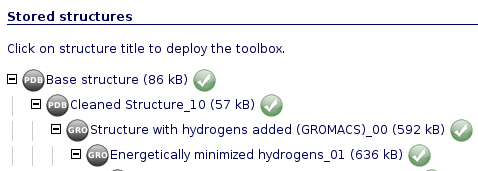
Once into a project, MDWeb interface has a hierarchical organization, starting from the base structure/trajectory (root of the tree) and going down applying operations and building new branches.
From the initial base object, a set of operations can be applied. These available operations are selected automatically depending on the nature of the structure. This helps the user to follow the right sequence of operations.
The type of structure is shown as an icon at the left part of the object name (See Icons).
Operations
Clicking on one of the project branches, a toolbox with the available operations appears. Operations can be divided in Molecular Dynamics tools (setup, simulation/optimization, analysis), and visualization tools (rasmol, Jmol).
Other operations include downloading results in a compressed tgz file, view logs of the operation, or delete the entire branch.
Toolbox icons::
| Operations | |
| Perform a new setup operation on the selected structure. | |
| Perform a new simulation/optimization. | |
| Perform a new analysis on the selected trajectory. | |
| Visualize structure using Rasmol compatible viewers (plug-in required). | |
| Visualize structure using JMol. | |
| Show log file | |
| Download results in a compressed tgz file. | |
| Delete item from the workspace. | |
Services List
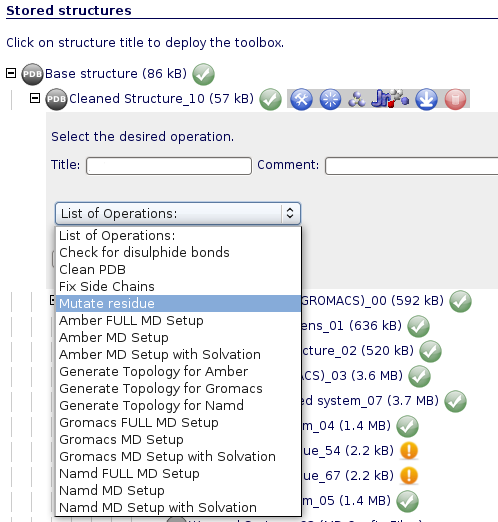
When choosing either setup, simulation/optimization or analysis operations, a selector with all the services that can use
the specific structure type as an input will appear.
Some of these services are simple processes (MDMoby webservices), whereas others are workflows involving preorganized sets of operations..
Services Parameters
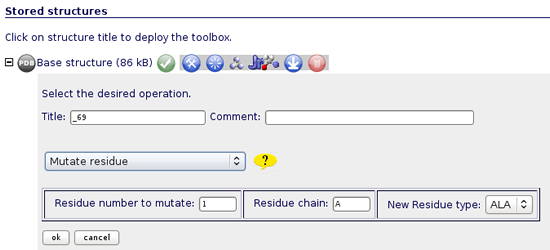
For services having input parameters, a specific form will appear, including the recommended values.
Service Parameters Example
When selecting a service, a question mark icon appears next to the selection list.
Passing over this icon with the mouse pointer triggers a small window with the most important information about the service and parameters.
For workflows, the set of steps is described. Clicking at the question mark icon a complete service description is shown.
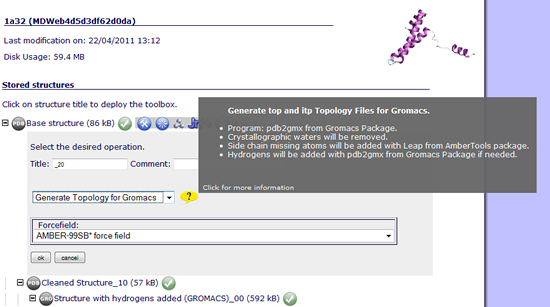
Quick Help Information Example
Visualization
Data can be visualized at any point during the process of setup or analysis.
For three-dimensional structures or trajectories, Rasmol scripts and JMol applet is offered with just a click.
In case of JMol applet, a new window will be opened with the visualization, together with some pre-configured JMol options such as
structure representation (Atoms, Ligands, Wireframe, Cartoon, HBonds) and Color (Structure, Chain).

JMol Visualization Example
In the analysis part, 2D plots (RMSd, Bfactors x Residue, etc.) can also be automatically visualized with MDWeb.
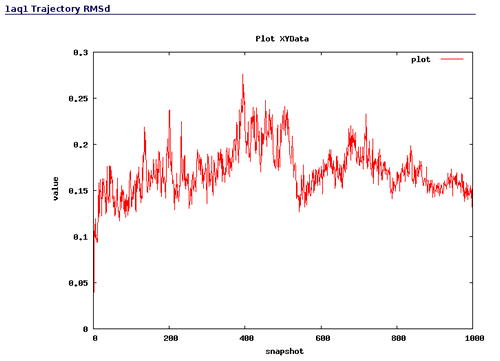
Analysis Plot Example