
NAFlex Coarse-Grained Simulations Analysis
NAFlex offers a couple of Coarse-Grained algorithms (low resolution, not atomistic) to quickly obtain a dynamic view of nucleic acid structures.
The resulting Coarse-Grained trajectories can not be analysed using the same set of tools offered by NAFlex for nucleic acids MD simulations, due to its low resolution. In fact, as a consequence of this coarse-grained reduction in complexity and resolution, many of the typical flexibility values such as HB and Stacking energies, proton couplings and helical parameters cannot be computed.
So, to obtain a graphical view of the flexibility of these Coarse-Grained trajectories, NAFlex implements a couple of specific analysis, taking into account the information that can be extracted from the low resolution trajectory generated.
The Coarse-Grained flexibility analysis are:
- Montecarlo Coarse-Grained Flexibility Analysis
- Worm-like Chain Model Coarse-Grained Flexibility Analysis
Montecarlo Coarse-Grained Flexibility Analysis
The Montecarlo Coarse-Grained Flexibility Analysis is divided in two main results:
- Distance Contact Maps
- Results by Time
The Results by Time section contains information about helical parameters associated to the Montecarlo algorithm along the simulation.
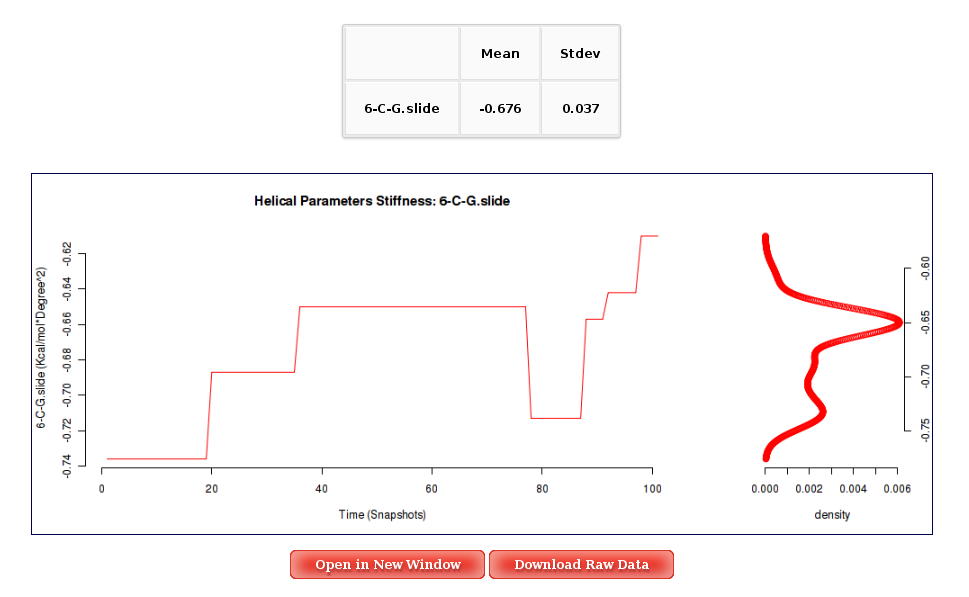
Montecarlo Coarse-Grained simulations work at a Base level, not taking into account nucleic acid phosphates (backbone) neither sugar rings. As the algorithm changes DNA Helical Parameters (Stiffness constants associated to 6 Base Pair Step Helical Parameters: 3 local rotations -roll, tilt and twist- and 3 local translations -slide, shift and rise-), these values and their movements can be analysed vs time.
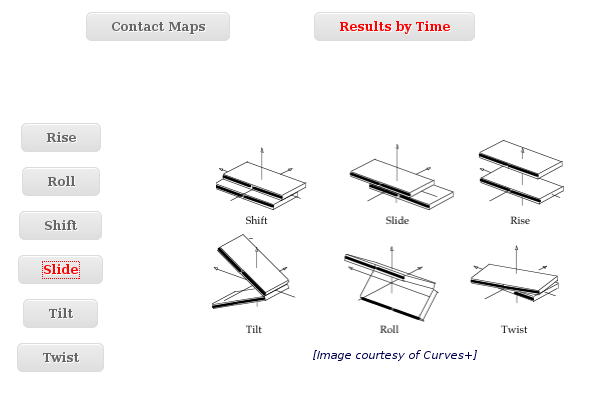
User can obtain plots of Inter-Base Pair Helical Parameters (for each Base Pair Step) vs time for the whole trajectory analysed. User will be asked to select a Base Pair Step (tetramer) to obtain the corresponding plot. The graphical representation of the sequence is very helpful when selecting desired Base Pair Steps (see Helical Params Help section). Plots generated contain the corresponding histogram attached, and an associated table with calculated mean and standard deviation values. Raw data and plot are also easily downloadable.
More information about Montecarlo Coarse-Grained Simulations can be found in the corresponding help section.
Worm-like Chain Model Coarse-Grained Flexibility Analysis
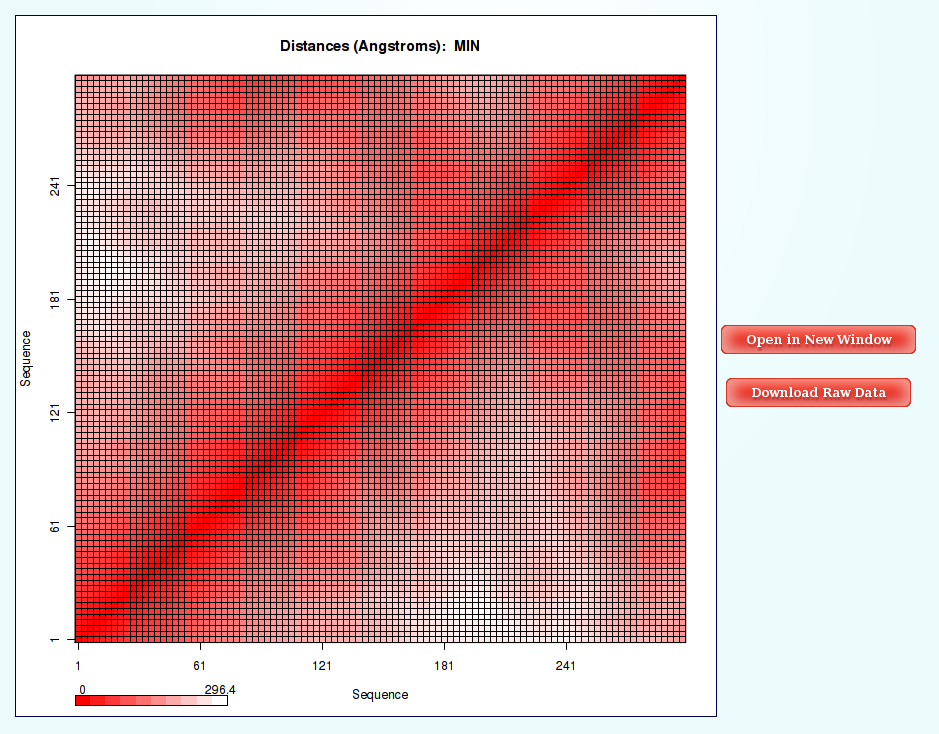
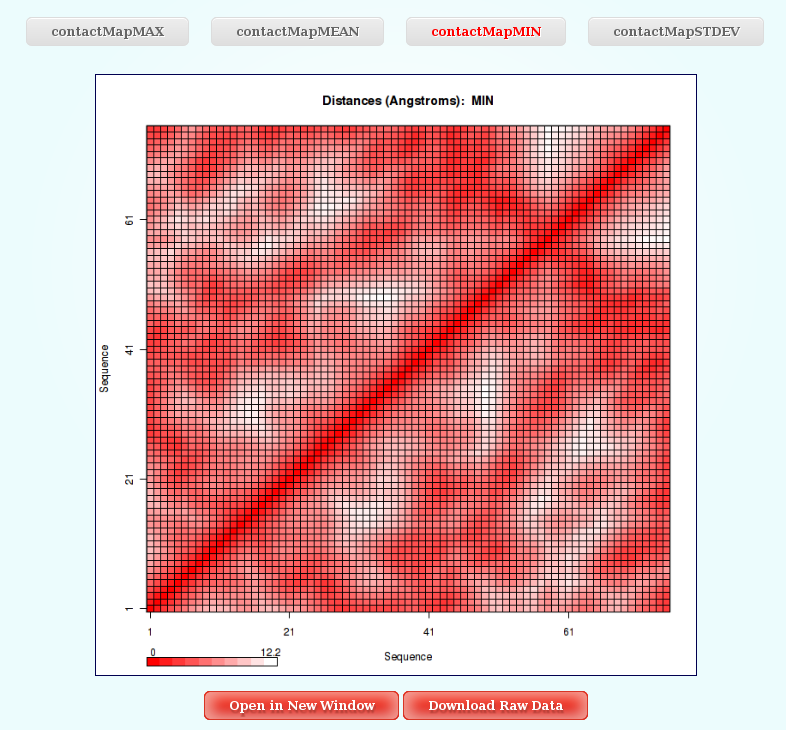
Worm-Like Chain Model Coarse-Grained simulations work at a very low resolution (1 bead every M Base Pair Steps), so reducing a lot the complexity of the system. For this reason, the only interesting and informative study that can be done to this extremely coarse-grained resulting trajectory is a distance analysis. And the chosen way to show the distance results is through Contact Map Plots.
Distances (for example distance mean or minimum distance) between all the pair of bases in a nucleic structure during a dynamic simulation can be very useful to obtain a picture of the flexibility of the structure and the movements that it undergoes during the dynamic simulation. In this case, resulting distances are those between coarse-grained beads (representing M base pair steps).
The most common way to look a this information is plotting it with Contact Maps. With these plots, a square is painted for every nucleotide (bead) pair, assigning a color depending on the value of the analysis (distance in this case). Usually, high values out of the diagonal (closest nucleotide pairs) are the most interesting and informative ones.
More information about Worm-Like Chain Model Coarse-Grained Simulations can be found in the corresponding help section.