
NAFlex Nucleic Acids Analysis Tutorial
NAFlex provides a friendly environment to analyse your own generated molecular dynamics trajectories of nucleic acid structures.
Please note that in this version of NAFlex, only double-stranded, standard nucleic acids can be analysed. Mispaired nucleotides, single-stranded nucleic acids, triplexes and quadruplexes are not currently supported in NAFlex flexibility analysis. Modified nucleotides are only allowed in some of the flexibility analysis operations.
User should follow three necessary steps before being able to analyse his/her own trajectory. These steps are registration, starting project, and uploading a trajectory. A short tutorial about these steps can be found in Uploading a Trajectory help section.
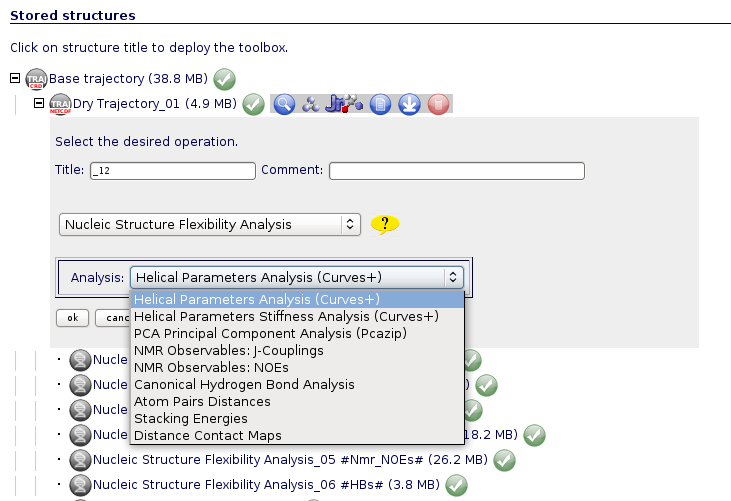
Once we have our trajectory uploaded, we can launch our Nucleic Acid Flexibility Analysis. NAFlex offers a set of Nucleic Acids flexibility analysis:
- Helical Parameters
- Stiffness Constants
- Principal Components
- Nuclear Magnetic Resonance Observables: J-Couplings
- Nuclear Magnetic Resonance Observables: NOE's
- Canonical Hydrogen Bond Analysis
- Atom Pairs Distances
- HB/Stacking Energies
- Distance Contact Maps
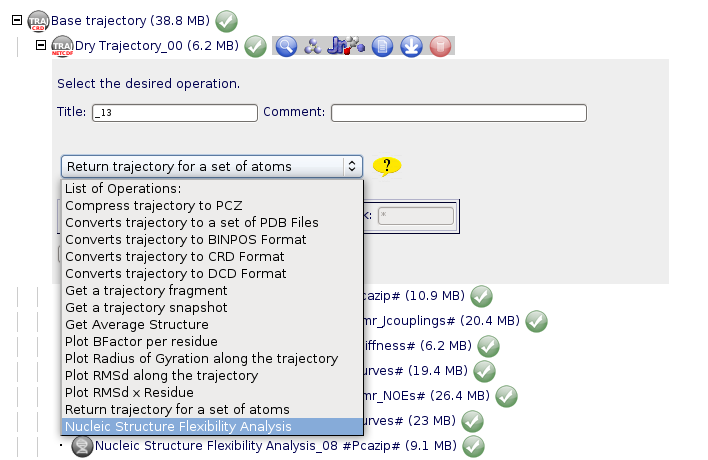
Then, we can choose between the list of possible analyses:
Each of the operations have its own web interface to graphically see and interpret the resulting data. These interfaces can be opened clicking at the View ![]() icon. A short piece of information for every analysis can be found in the coming lines.
icon. A short piece of information for every analysis can be found in the coming lines.
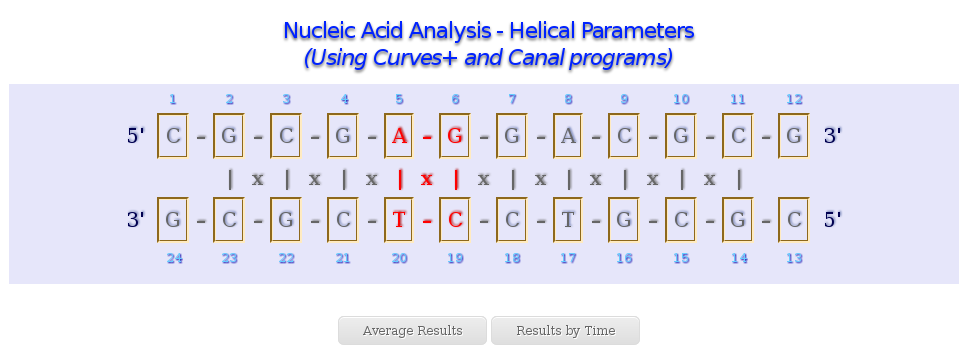
Helical Parameters
When analysing Nucleic Acid Helical Parameters, a graphical representation of the two sequence strands will appear on the screen. This representation allows a user-friendly selection of nucleotides, base pairs and base pair steps (tetramers), just clicking at the corresponding region of the sequence. For example, to select a base pair, user may click at the | symbol between nucleotides (from different strands) involved in the interesting base-pair, to select a base pair step, at the x symbol between nucleotides involved in the interesting tetramer, and just over a nucleotide one-letter code to select the corresponding nucleotide.
The Helical Parameters analysis is divided in two main results:
- Average Results
- Results by Time
- Backbone Torsions
- Axis Base Pair
- Intra-Base Pair Helical Parameters
- Inter-Base Pair Helical Parameters
- Grooves
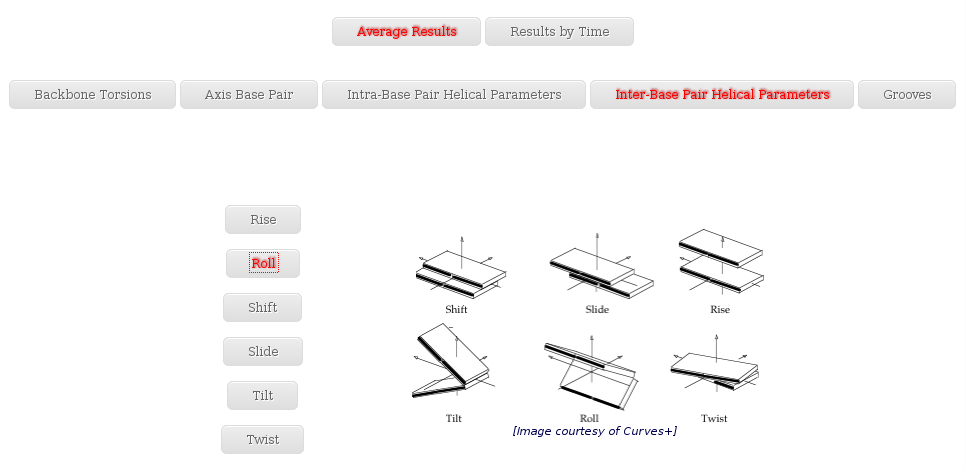
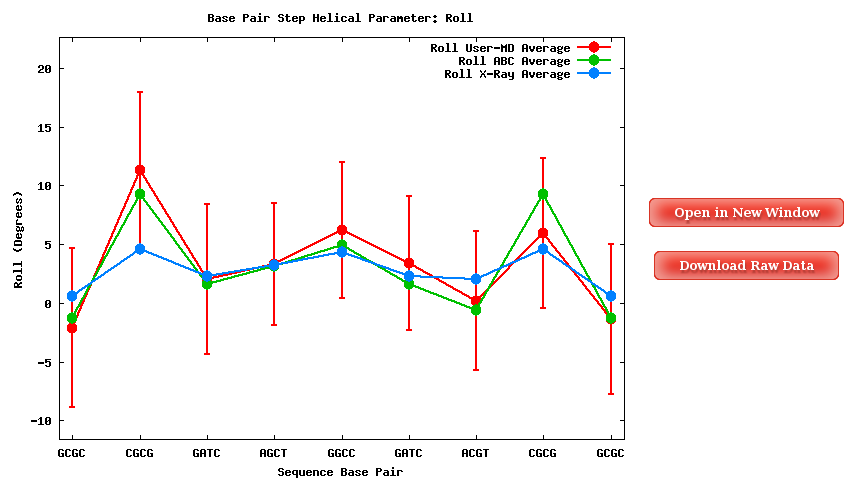
The Average Results section contains a set of plots generated after computing average values for all the trajectory snapshots. Plots and their associated raw data can be downloaded form the link provided.
When available, published data corresponding to the selected parameter set are plotted for comparison.
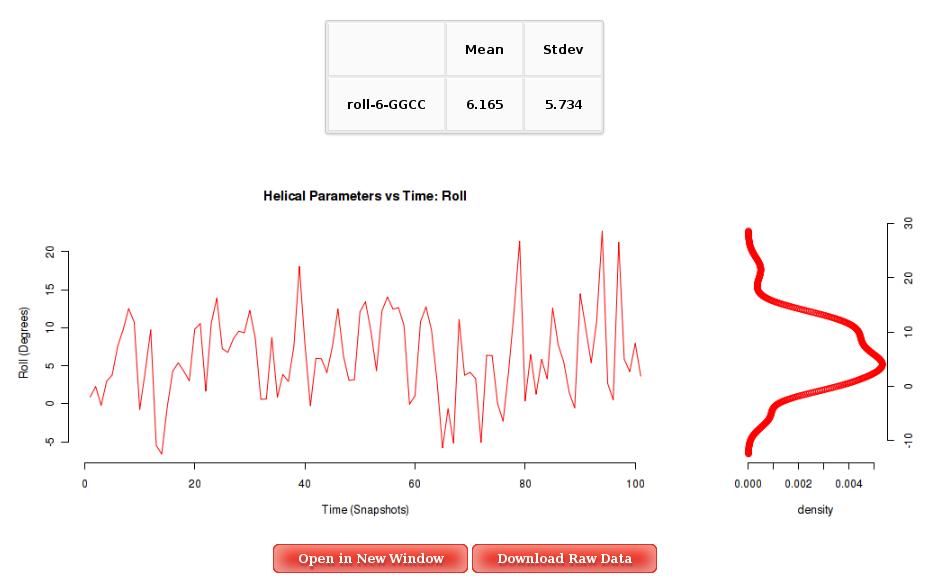
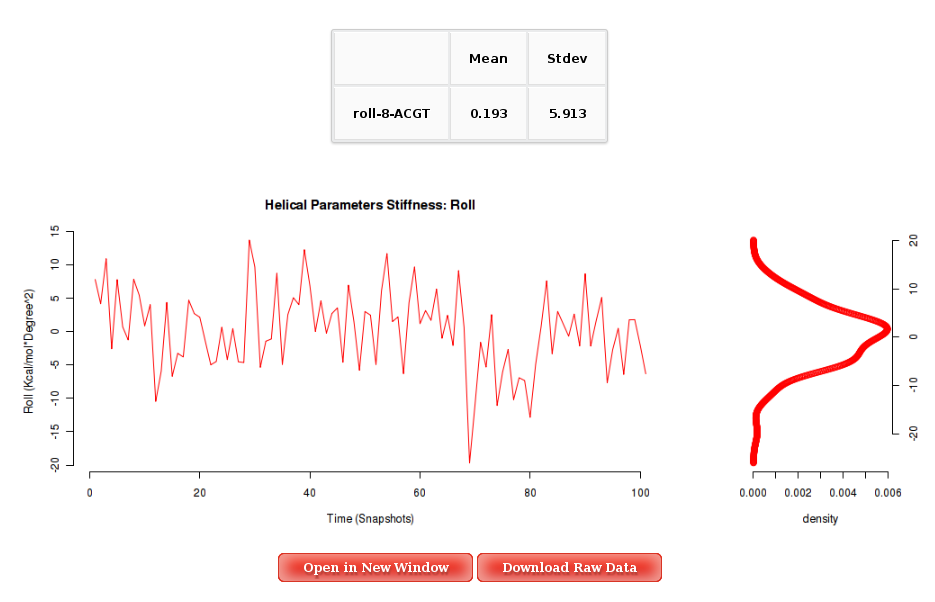
Into the Results by Time section, user can obtain plots of selected parameter vs time for the whole trajectory analysed, and for each of the corresponding primary entity, that depends on the parameter. For example, user will be asked to select a nucleotide to obtain Backbone Torsions, a Base Pair to obtain Axis and Intra-Base Pair parameters, and a Base Pair Step (tetramer) for Inter-Base Pair parameter and Grooves. The graphical representation of the sequence is very helpful when selecting the desired primary entities.
Plots generated contain the corresponding histogram attached, and an associated table with calculated mean and standard deviation values.
More information about Helical Parameters can be found in the corresponding help section.
Stiffness Constants
When analysing Nucleic Acid Stiffness Constants, the resulting web page will show again the graphical representation of the sequence strands (see previous section).
The Stiffness Constants analysis is divided in two main sections:
- Average Results
- Results by Time
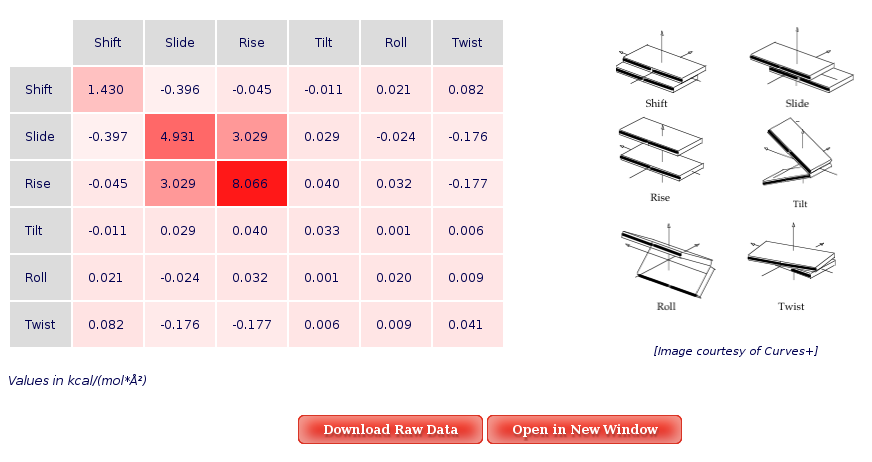
The Average Results section contains a set of Stiffness Matrices (determined by the inversion of the covariance matrix in helical space) for each sequence Base Pair Step.
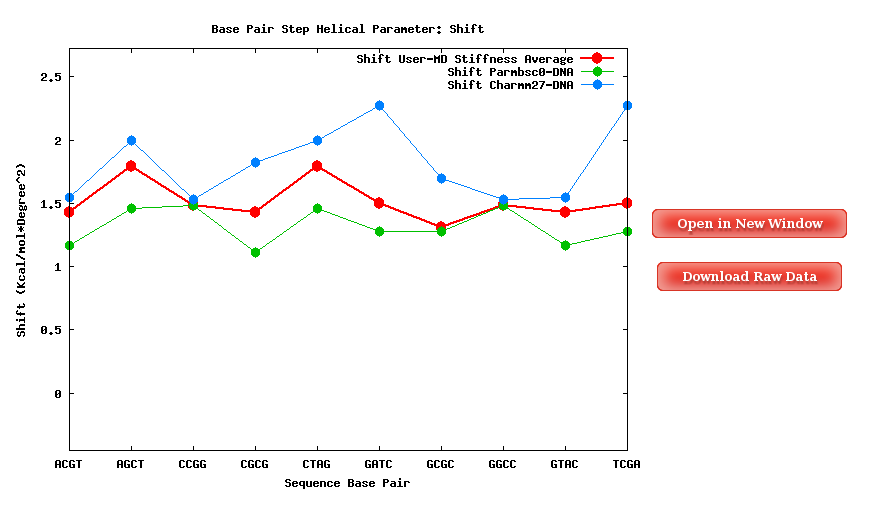
A set of average plots generated computing average values for all the Stiffness Constants associated to a Base Pair Step (average of the diagonal elements of the Stifness Matrices) are also offered.
When available, published data corresponding to the selected parameter are plotted for comparison. Plots and its associated raw data can be downloaded from the link provided.
Into the Results by Time section, user can obtain plots of Inter-Base Pair Helical Parameters (for each Base Pair Step) vs. time for the whole trajectory analysed. User will be asked to select a Base Pair Step (tetramer) to obtain the corresponding plot. The graphical representation of the sequence is very helpful when selecting desired Base Pair Steps.
More information about Stiffness Constants can be found in the corresponding help section.
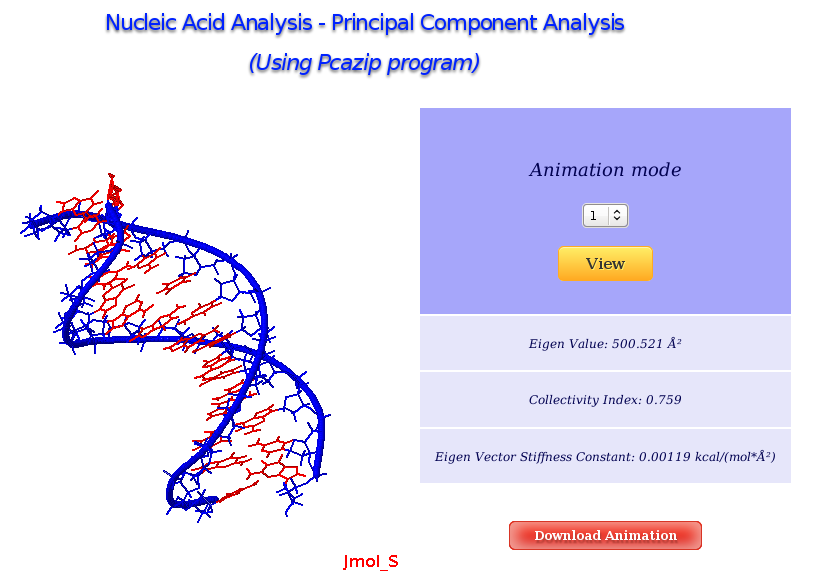
Principal Component Analysis
The Principal Component Analysis graphical interface offers the possibility of studying the real movements of the structure through the projections of the trajectory onto the different essential modes. An interactive JMol applet shows these movements, allowing user to translate, rotate and in general manipulate the visualization. The first 10 animation modes are offered for visualization and download. Associated values as eigenvalues, collectivity indexes and eigenvector stiffness constants are also shown.
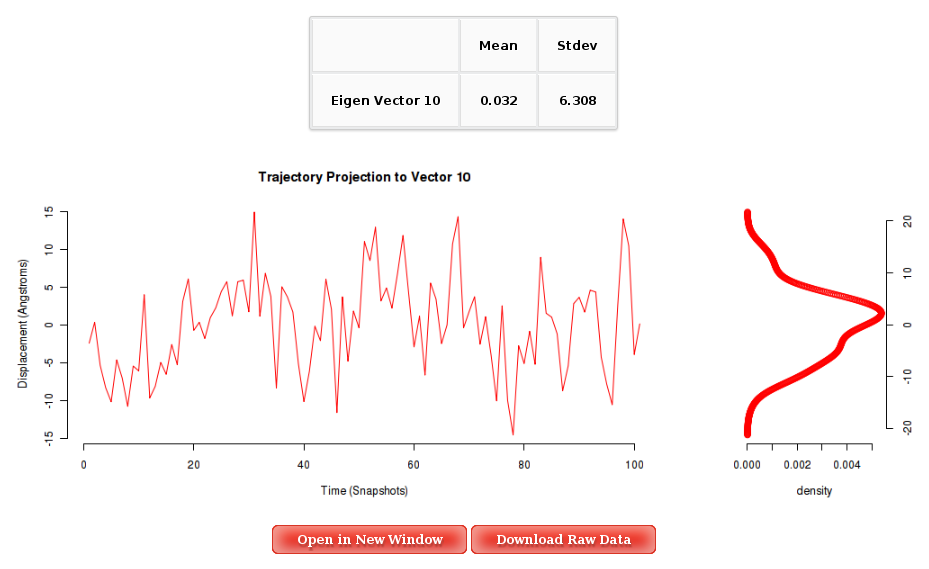
For each of the first 10 eigenvectors, a plot containing the displacement (in Angstroms) of the projections of all the trajectory snapshots into the associated eigenvector from the first snapshot is also computed and shown. Plots generated contain the corresponding histogram attached, and an associated table with calculated mean and standard deviation values. Raw data and plot are also easily downloadable.
More information about Principal Component Analysis can be found in the corresponding help section.
Nuclear Magnetic Resonance Observables: J-Couplings
When analysing NMR J-Couplings, the resulting web page will show again the graphical representation of the sequence strands (see Helical Parameters section).
The J-Couplings analysis is divided in two main results:
- Average Results
- Results by Time
- Jcoupling: H1' - H2'
- Jcoupling: H2' - H3'
- Jcoupling: H3' - H4'
- Jcoupling: H1' - H2'' (Only in DNA case)
- Jcoupling: H2'' - H3' (Only in DNA case)
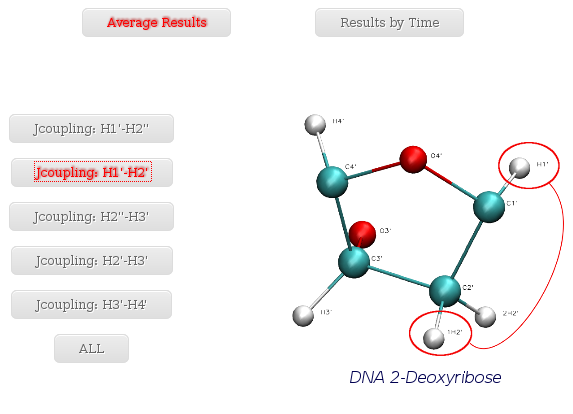
When selecting a specific proton pair, a plot with the average J-Coupling values for each of the nucleotides of the trajectory sequence will be shown.
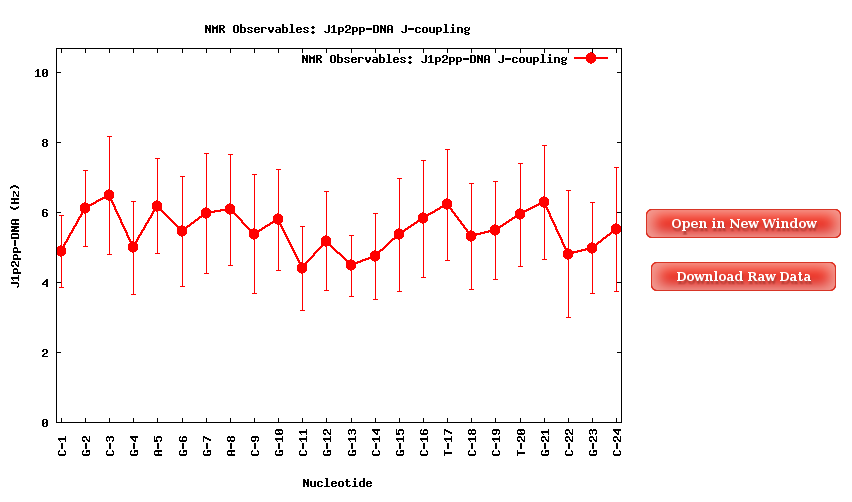
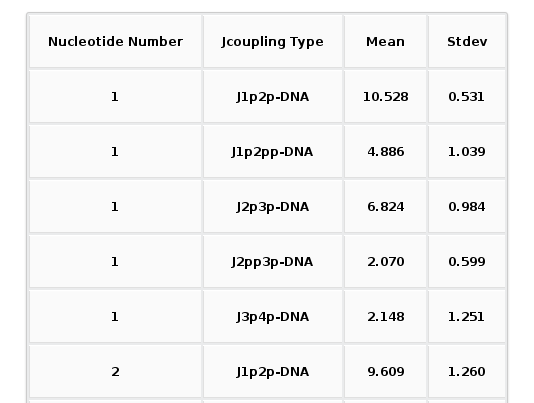
Together with the proton pair options, it is also an ALL button. When selected, a table with all the average values (mean and standard deviation) for all the proton pairs and all the trajectory sequence nucleotides is shown. Both plots (with its associated raw data) and table can be easily downloaded.
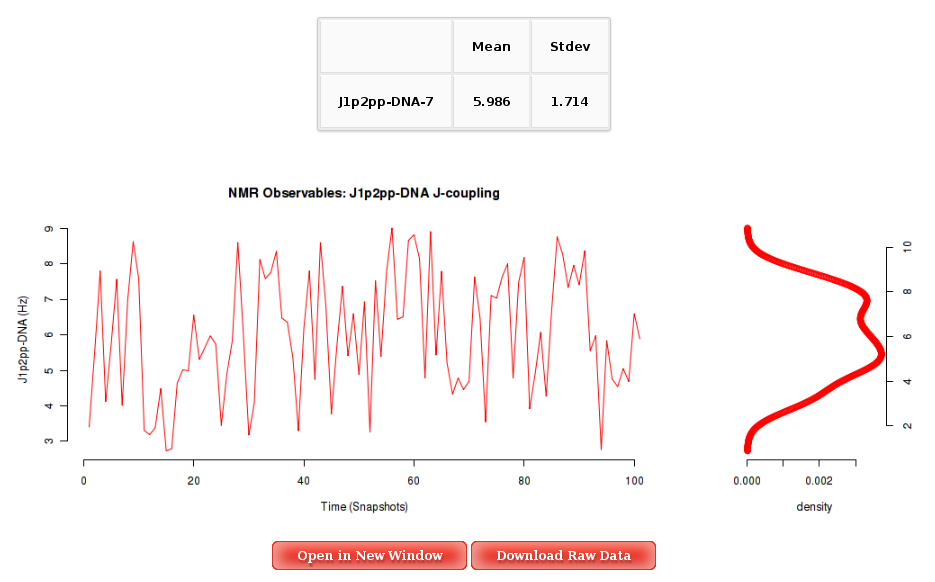
The Results by Time section contains the plots for the J-Couplings observables vs time for each of the sequence nucleotide. User will be asked to select a specific Nucleotide from the trajectory sequence (using the graphical representation of the sequence) to obtain the corresponding plot. Plots generated contain the corresponding histogram attached, and an associated table with calculated mean and standard deviation values.
More information about NMR J-Coupling Analysis can be found in the corresponding help section.
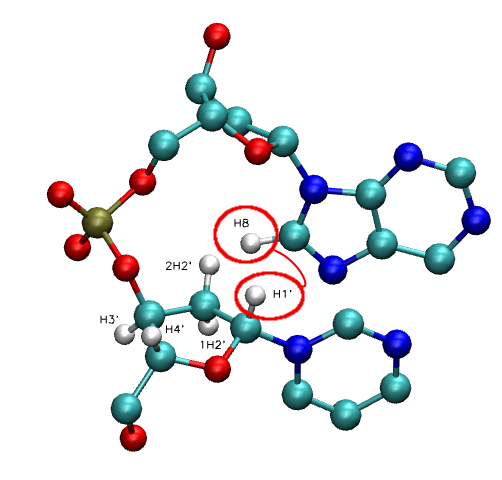
Nuclear Magnetic Resonance Observables: NOE's
Nuclear Magnetic Resonance Nuclear Overhauser Effect (NOE) can be used to determine intra/inter-molecular distances. Again, a graphical representation of the sequence strands (see Helical Parameters section) will be shown, helping in the selection of nucleotides/base pairs/base pair steps.
The NOE analysis is divided in two main results:
- Average Results
- Results by Time
Intra-Nucleotide:
- NOE: H1' - H2' | H1' - H3' | H1' - H4'
- NOE: H2' - H3' | H2' - H4'
- NOE: H3' - H4'
- NOE: H1' - H6/H8 | H2' - H6/H8 | H3' - H6/H8 | H4' - H6/H8
- NOE: H5 - H6
- NOE: H2'' - H1' | H2'' - H3' | H2'' - H4' (Only in DNA case)
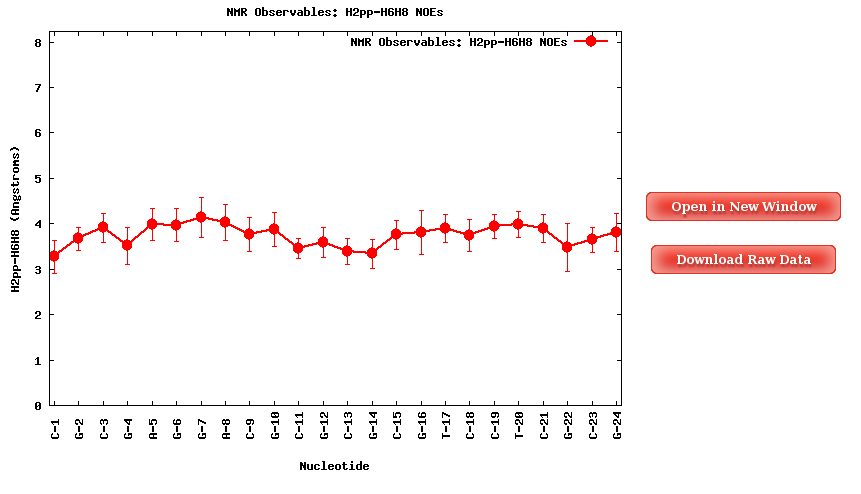
- NOE: H2'' - H6/H8 (Only in DNA case)
Inter-Nucleotide:
- NOE: H1' - H6/H8 (+1) | H2' - H6/H8 (+1) | H3' - H6/H8 (+1) | H4' - H6/H8 (+1)
- NOE: H2'' - H6/H8 (+1) (Only in DNA case)
When clicking one of the proton pairs, a plot containing the average distances (in Angstroms) for the specific proton pair for each of the nucleotides in the sequence will be shown. Plots and its associated raw data can be easily downloaded.
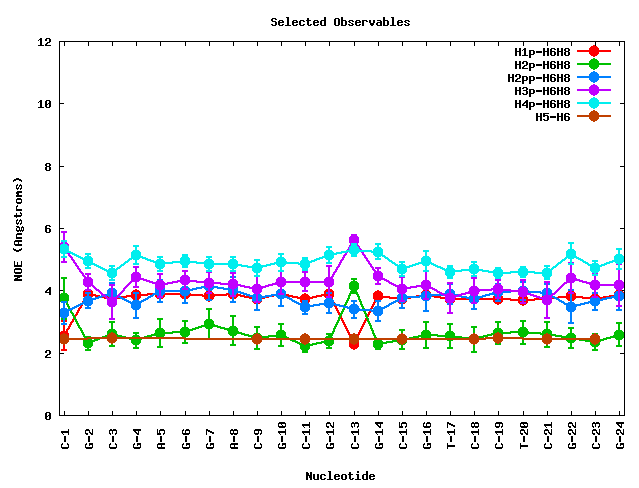
NAFlex offers the possibility to plot more than one of the NOE distances in the same plot. To do so, user should select the set of interesting proton pairs (with the checkboxes), and then click at Show Selected Observables.
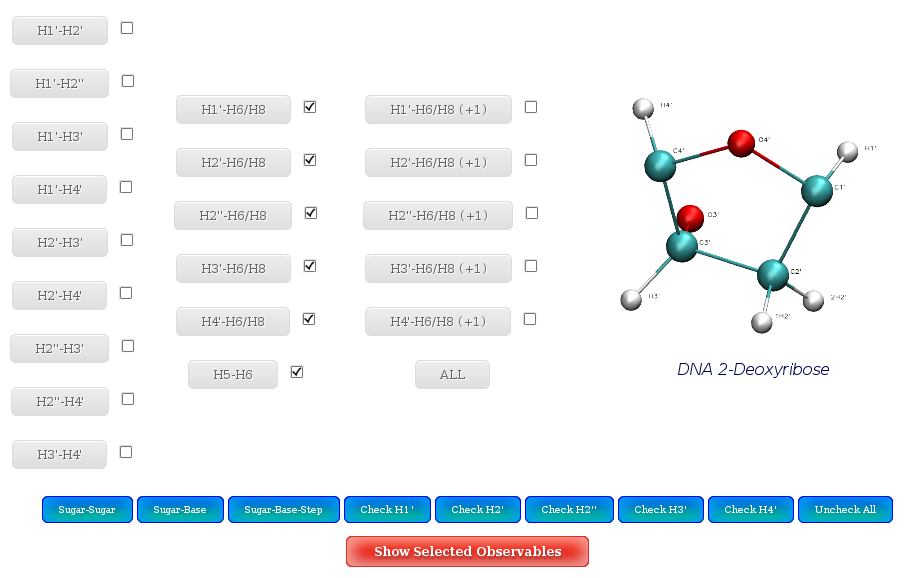
A set of buttons to automatically check interesting proton pairs are offered:
 By proton pair position:
- Sugar-Sugar: Intra-Sugar proton pairs.
- Sugar-Base: Sugar-Base proton pairs.
- Sugar-Base Step: Sugar-Base Step proton pairs.
By specific proton:
- H1': All proton pairs involving H1'
- H2' All proton pairs involving H2'
- H3' All proton pairs involving H3'
- H4' All proton pairs involving H4'
- H2'' All proton pairs involving H2'' (Only in DNA case)
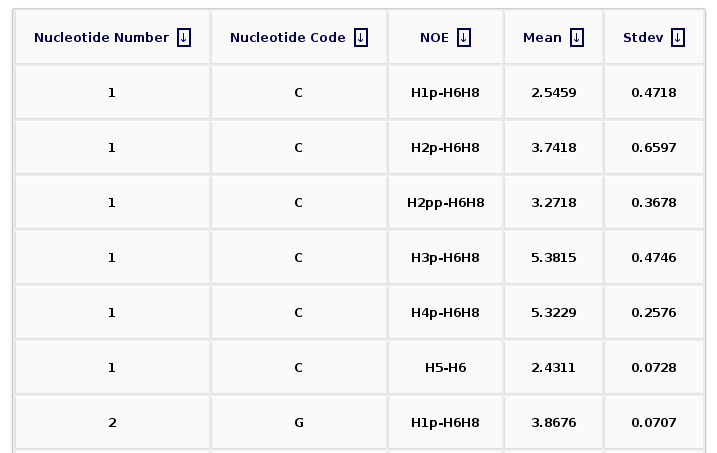
After clicking at the Show Selected Observables button, the corresponding plot will be computed, and a new web page will be opened. The plot is shown together with a table enclosing the raw data (mean and standard deviation) for the selected proton pairs. The table can be sorted by columns, helping then to obtain information for a specific nucleotide number, nucleotide code, or NOE observable.
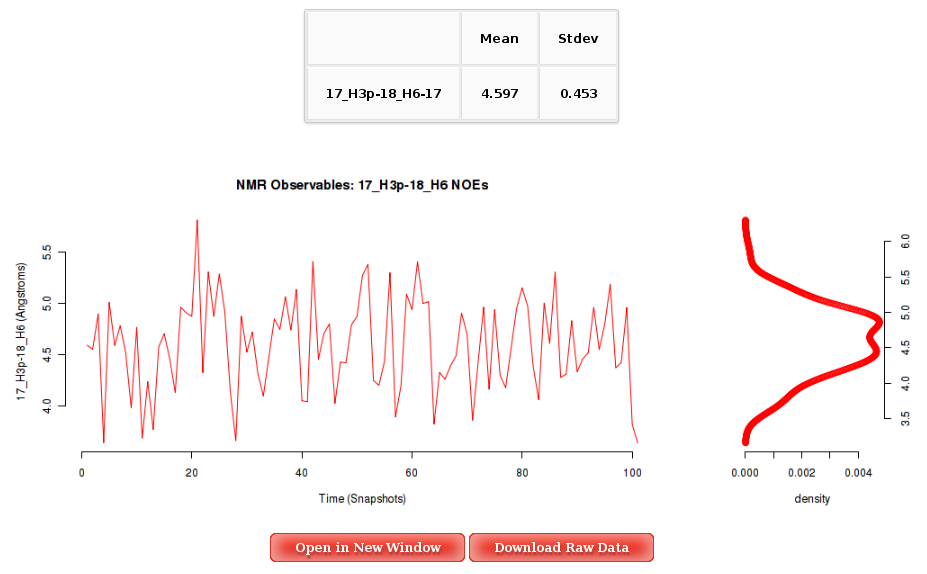
The Results by Time section contains the plots for the NOE observables vs time for each of the sequence nucleotide/base pair step. User will be asked to select a specific Nucleotide (if intra-nucleotide selected NOE) or Base Pair Step (if inter-nucleotide selected NOE) from the trajectory sequence (using the graphical representation of the sequence) to obtain the corresponding plot. Plots generated contain the corresponding histogram attached, and an associated table with calculated mean and standard deviation values.
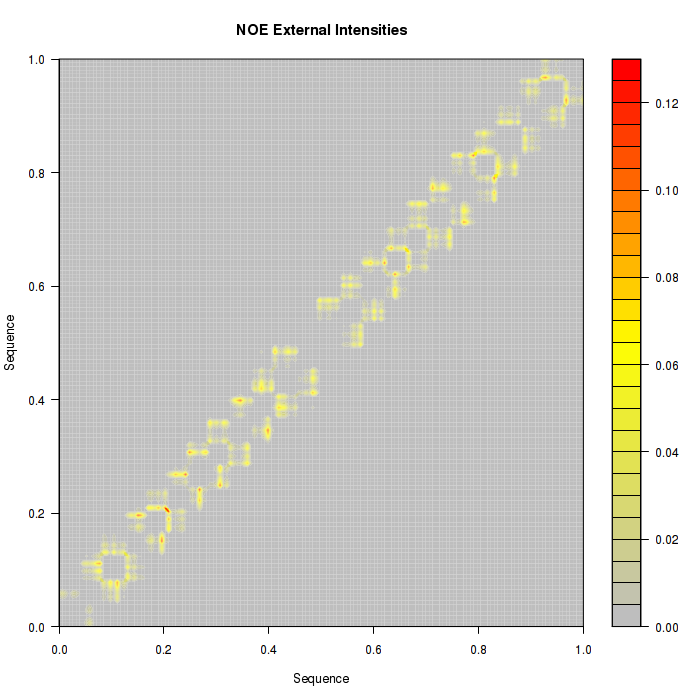
Proton pair distances are also transformed into Intensities and represented as a countour plot. Two pictures are available, one with the information of all the proton pairs studied in NOEs analysis, and another one with all the information not belonging to proton pairs from the same nucleotide (external).
More information about NMR NOE Analysis can be found in the corresponding help section.
Canonical Hydrogen Bond Analysis
To graphically analyse the canonical Hydrogen Bond interactions between bases, NAFlex offers an independent interface, again with a graphical representation of the sequence strands (see Helical Parameters section) to help in the selection of base pair steps.
Hydrogen Bond analysis is divided in two main sections:
- Average Results
- Results by Time
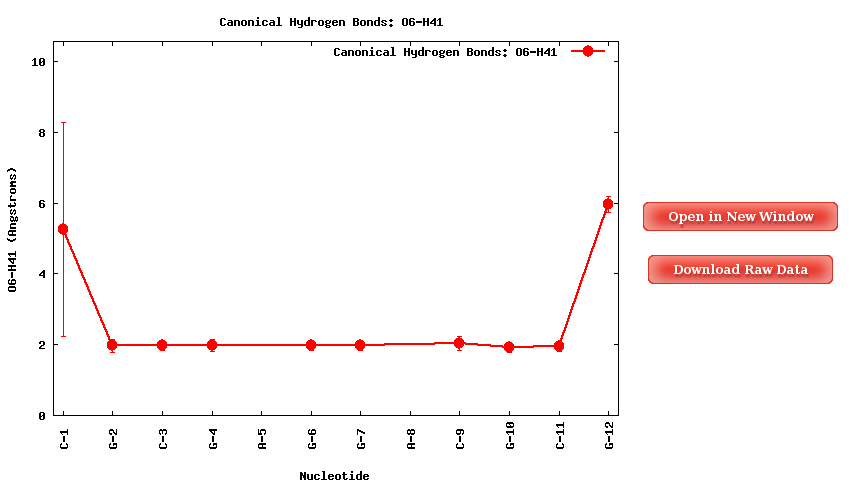
The Average Results contain the average HBs distances for the each of the base pairs in the sequence, divided in HB atom pairs:
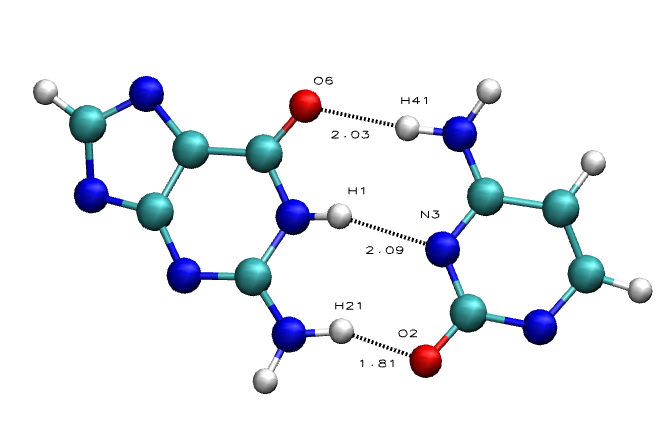
Purine-Pyrimidine HBs:
- Adenine N1 - Thymine/Uracil H3
- Adenine H61 - Thymine/Uracil O4
- Guanine O6 - Cytosine H41
- Guanine H1 - Cytosine N3
- Guanine H21 - Cytosine O2
Clicking one of the Hydrogen Bond pairs, a plot containing the average distances (in Angstroms) for the specific bond for each of the nucleotides in the sequence will be shown. Plots and its associated raw data can be easily downloaded.
The Results by Time section contains the plots for the Hydrogen Bond distance (in Angstroms) vs time for each of the sequence base pairs. User will be asked to select a specific base pair from the trajectory sequence (using the graphical representation of the sequence) and a specific hydrogen bond atom pair to obtain the corresponding plot. Plots generated contain the corresponding histogram attached, and an associated table with calculated mean and standard deviation values.
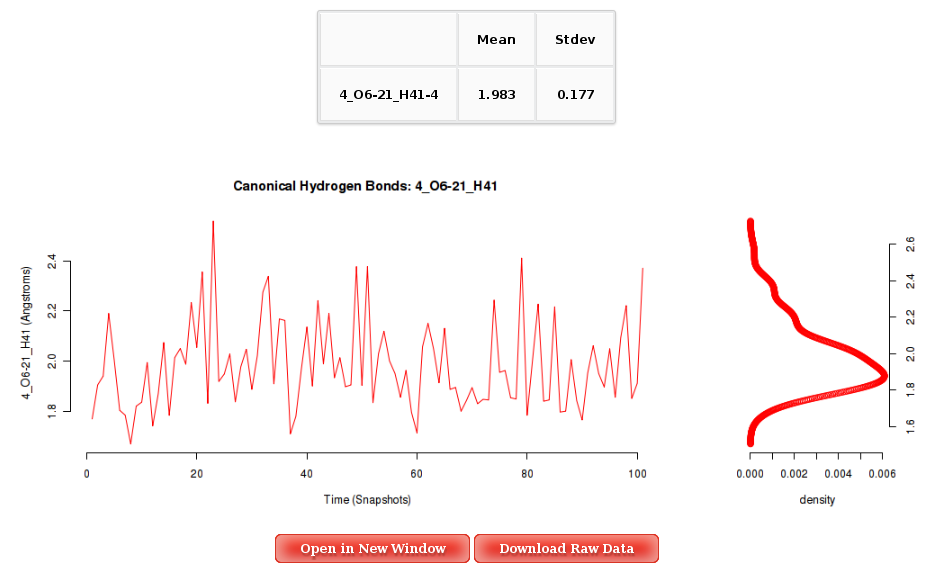
More information about Hydrogen Bond Distance Analysis can be found in the corresponding help section.
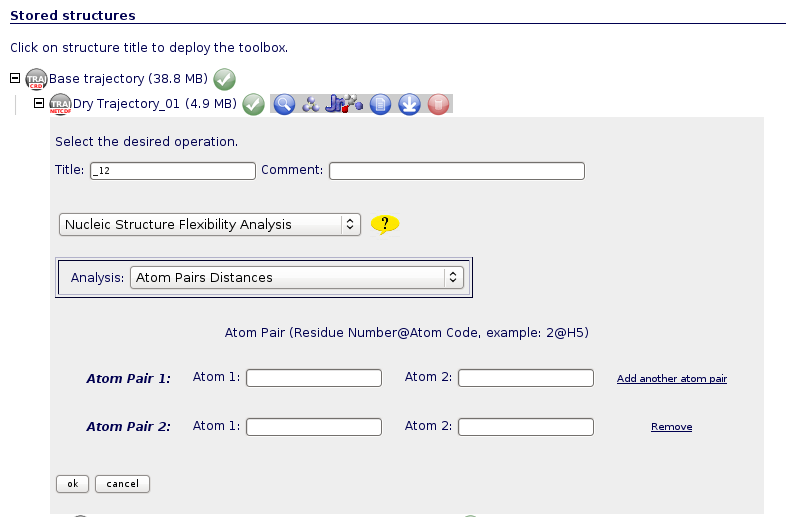
Atom Pairs Distances
Distances between atom pairs could be of interest when analysing flexibility from a nucleic acids simulation. For example, choosing atoms from the structure ends can give information about the global nucleic acid bending.
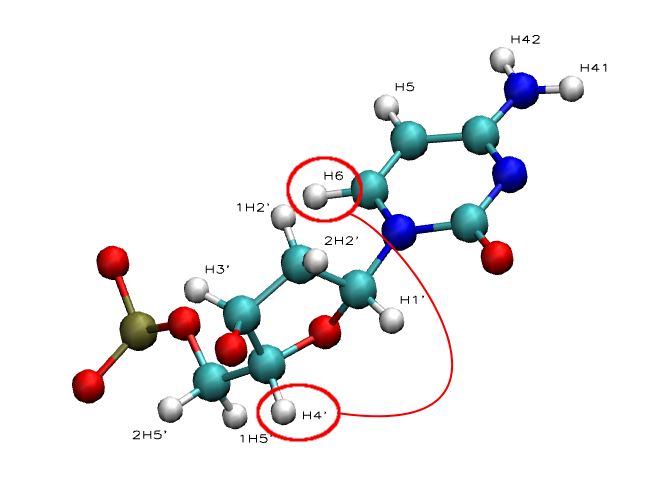
To run this analysis, user should introduce the desired atom pairs in the format: Residue Number@Atom Code (ex: 2@H5). Residue/atom codes can be confirmed using the JMol visualizer (opening the trajectory, or even better opening just a single snapshot from the trajectory). JMol is available in the NAFlex toolbox  . The correct atom name and residue code can be obtained just clicking with the mouse on the desired atom (or keeping the mouse over the atom for a second).
Once distances are computed, the graphical interface for this analysis will just show the different atom pairs Time plot with their corresponding associated histogram. Clicking at the desired atom pair button will launch the corresponding plot.
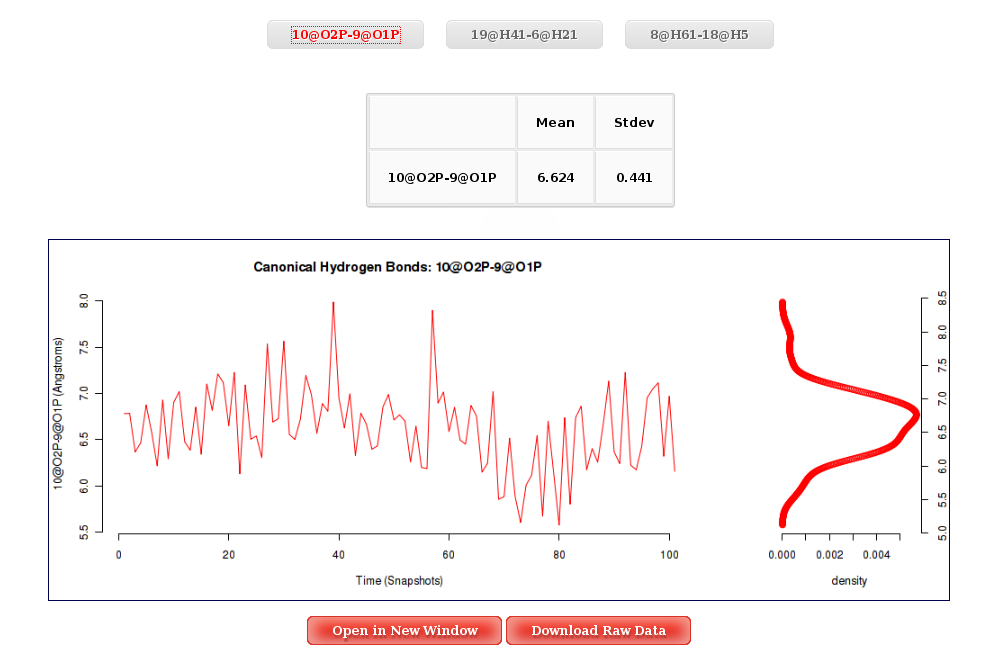
More information about Atom Pairs Distances can be found in the corresponding help section.
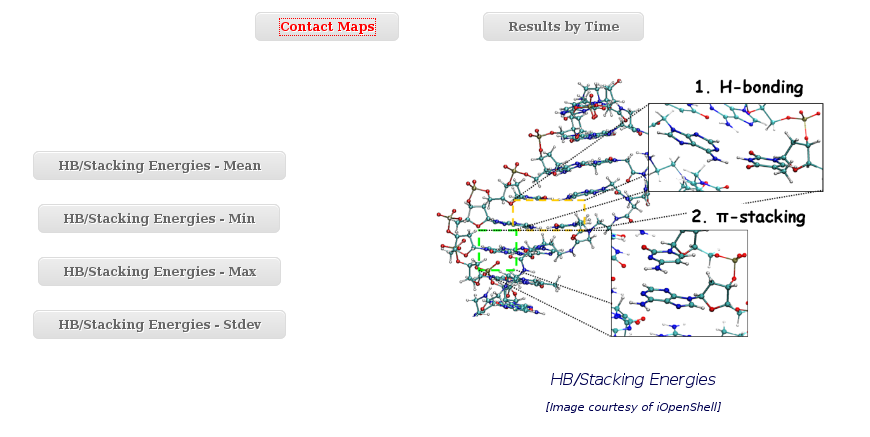
HB/Stacking Energies
To graphically analyse the Base Pair Hydrogen Bond interaction energies and the Base Pair Stacking energies, NAFlex offers an independent interface, including two different sections:
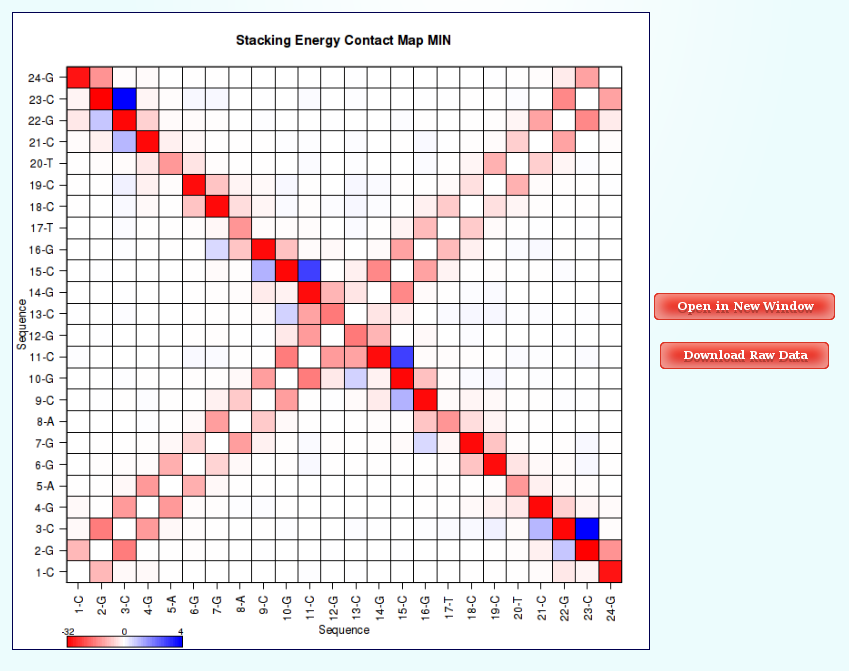
- Contact Maps
- Results by Time
Within the Contact Maps section, user can visualize Contact Maps Plots for the interaction energies between every base pair in the nucleic acid structure. In these plots, a square is painted for every nucleotide pair, assigning a color depending on the interaction energy value. Usually, high values in the top-left to bottom-right diagonal shows HB interaction energies for Base Pairs, while top-right to bottom-left diagonal shows Stacking interaction energies.
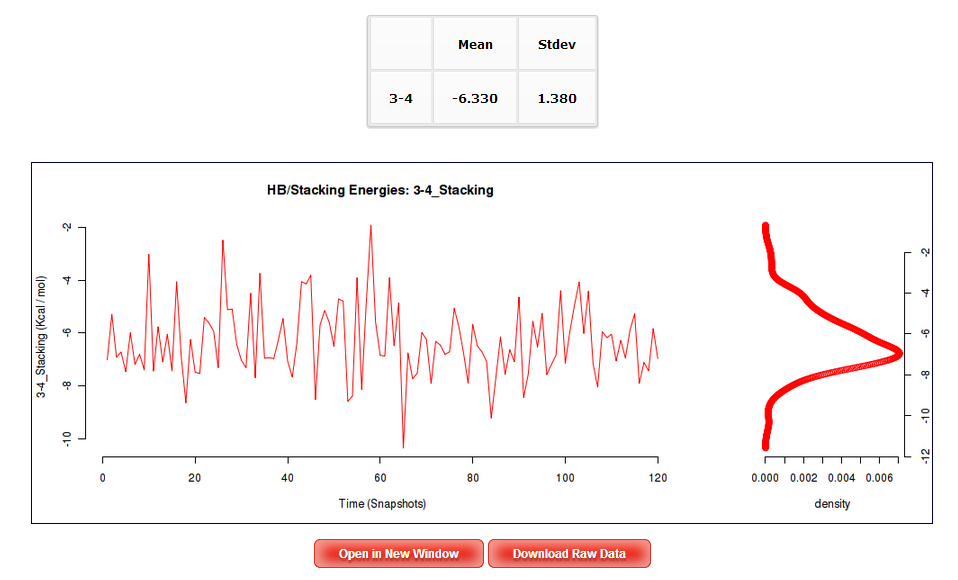
The Results by Time section contains the plots for the Hydrogen Bond interaction energies and the Stacking energies (in Kcal/mol) vs time for each of the sequence base pair/base pair step.
Again, a graphical representation of the sequence strands (see Helical Parameters section) to help in the selection of base pair/base pair steps is offered.
In order to see a Hydrogen Bond interaction plot, user will be asked to select a specific base pair from the trajectory sequence (using the graphical representation of the sequence, see below). Similarly, to see a Stacking interaction plots, user will be asked to select a specific base pair from the trajectory sequence. Plots generated contain the corresponding histogram attached, and an associated table with calculated mean and standard deviation values.
 In the case of Stacking interaction energies, four different plots vs Time will be shown. These plots corresponds to the Stacking energy between a nucleotide of the tetramer and its covalently bonded neighbour placed just above in the first strand (nucleotides 2 and 3 in the picture), between a nucleotide of the tetramer and its covalently bonded neighbour placed just above in the second strand (nucleotides 1 and 4 in the picture), between a nucleotide of the tetramer and the one just above its pair in the complementary strand (nucleotides 2 and 1 in the picture), and between a nucleotide of the tetramer and the one just under its pair in the complementary strand (nucleotides 3 and 4 in the picture). Image from Phys. Chem. Chem. Phys., 2010,12, 1369-1378.
More information about HB/Stacking Energies can be found in the corresponding help section.
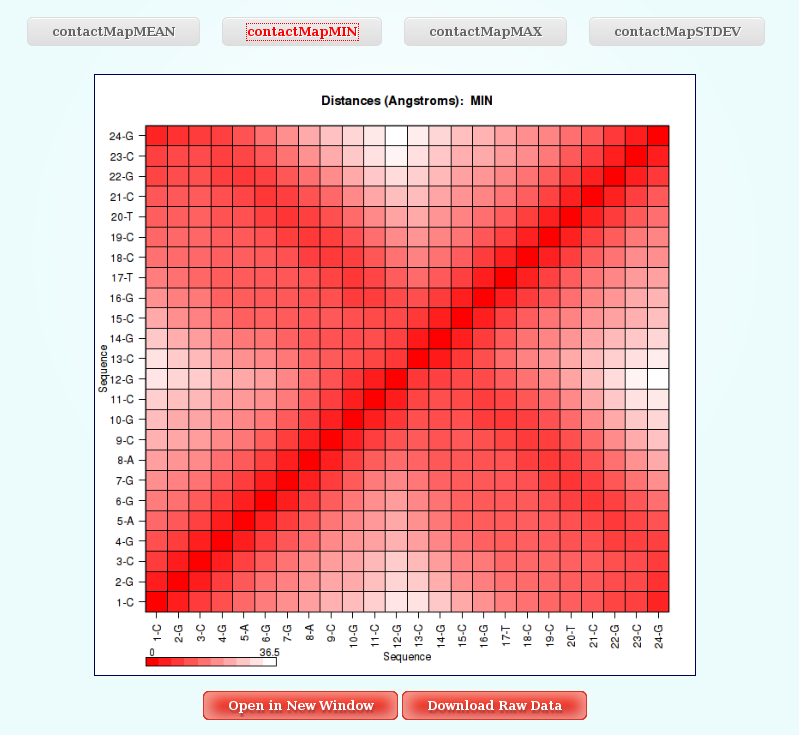
Distance Contact Maps
In this analysis, user just have to choose between the different Distance Contact Maps offered by the server clicking at the corresponding button. The plot will be shown with a color legend, and like all the different plots generated by NAFlex, with the associated links giving the possibility to open it in a new window and download the raw data.
More information about Distance Contact Maps can be found in the corresponding help section.