CGeNArateWeb Help - Analysis Contacts
Distance Contact Maps
Method
Information as the distances (for example distance mean or minimum distance) between all the pair of bases in a nucleic structure during a dynamic simulation can be very useful to obtain a picture of the flexibility of the structure and the movements that it undergoes during the dynamic simulation.
The most common way to look at this information is plotting it with Contact Maps. With these plots, a square is painted for every nucleotide pair, assigning a color depending on the value of the analysis (distance in this case). Usually, high values out of the diagonal (closest nucleotide pairs) are the most interesting and informative ones.
Results
In this analysis, users just have to choose between the different Distance Contact Maps offered by the server clicking at the corresponding button. The plot will be shown with a color legend, and like all the different plots generated by CGeNArateWeb, with the associated links giving the possibility to open it in a new window and download the raw data.
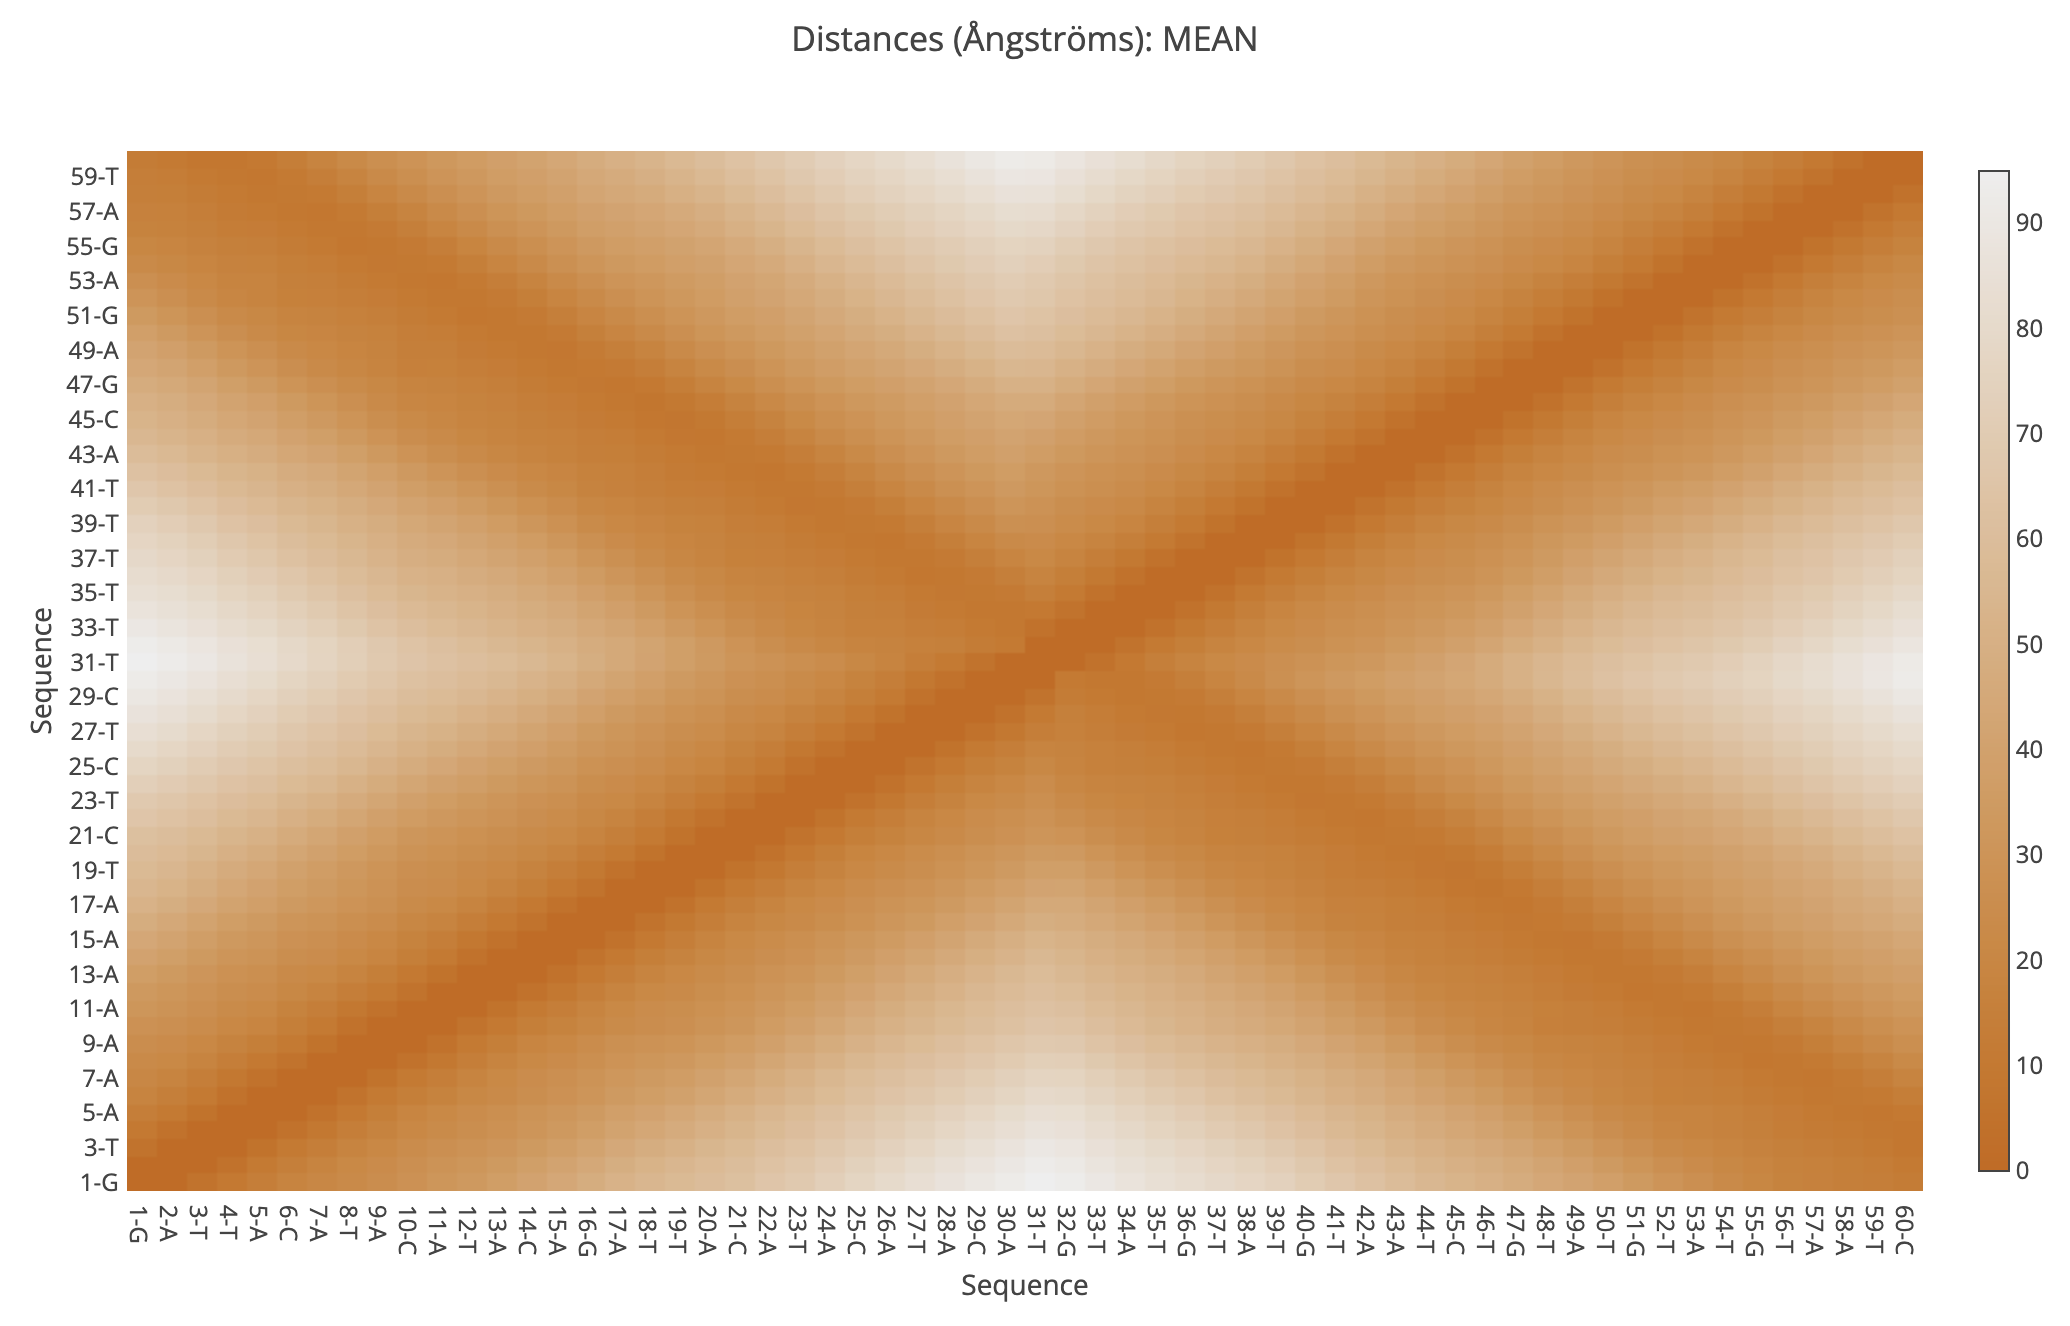
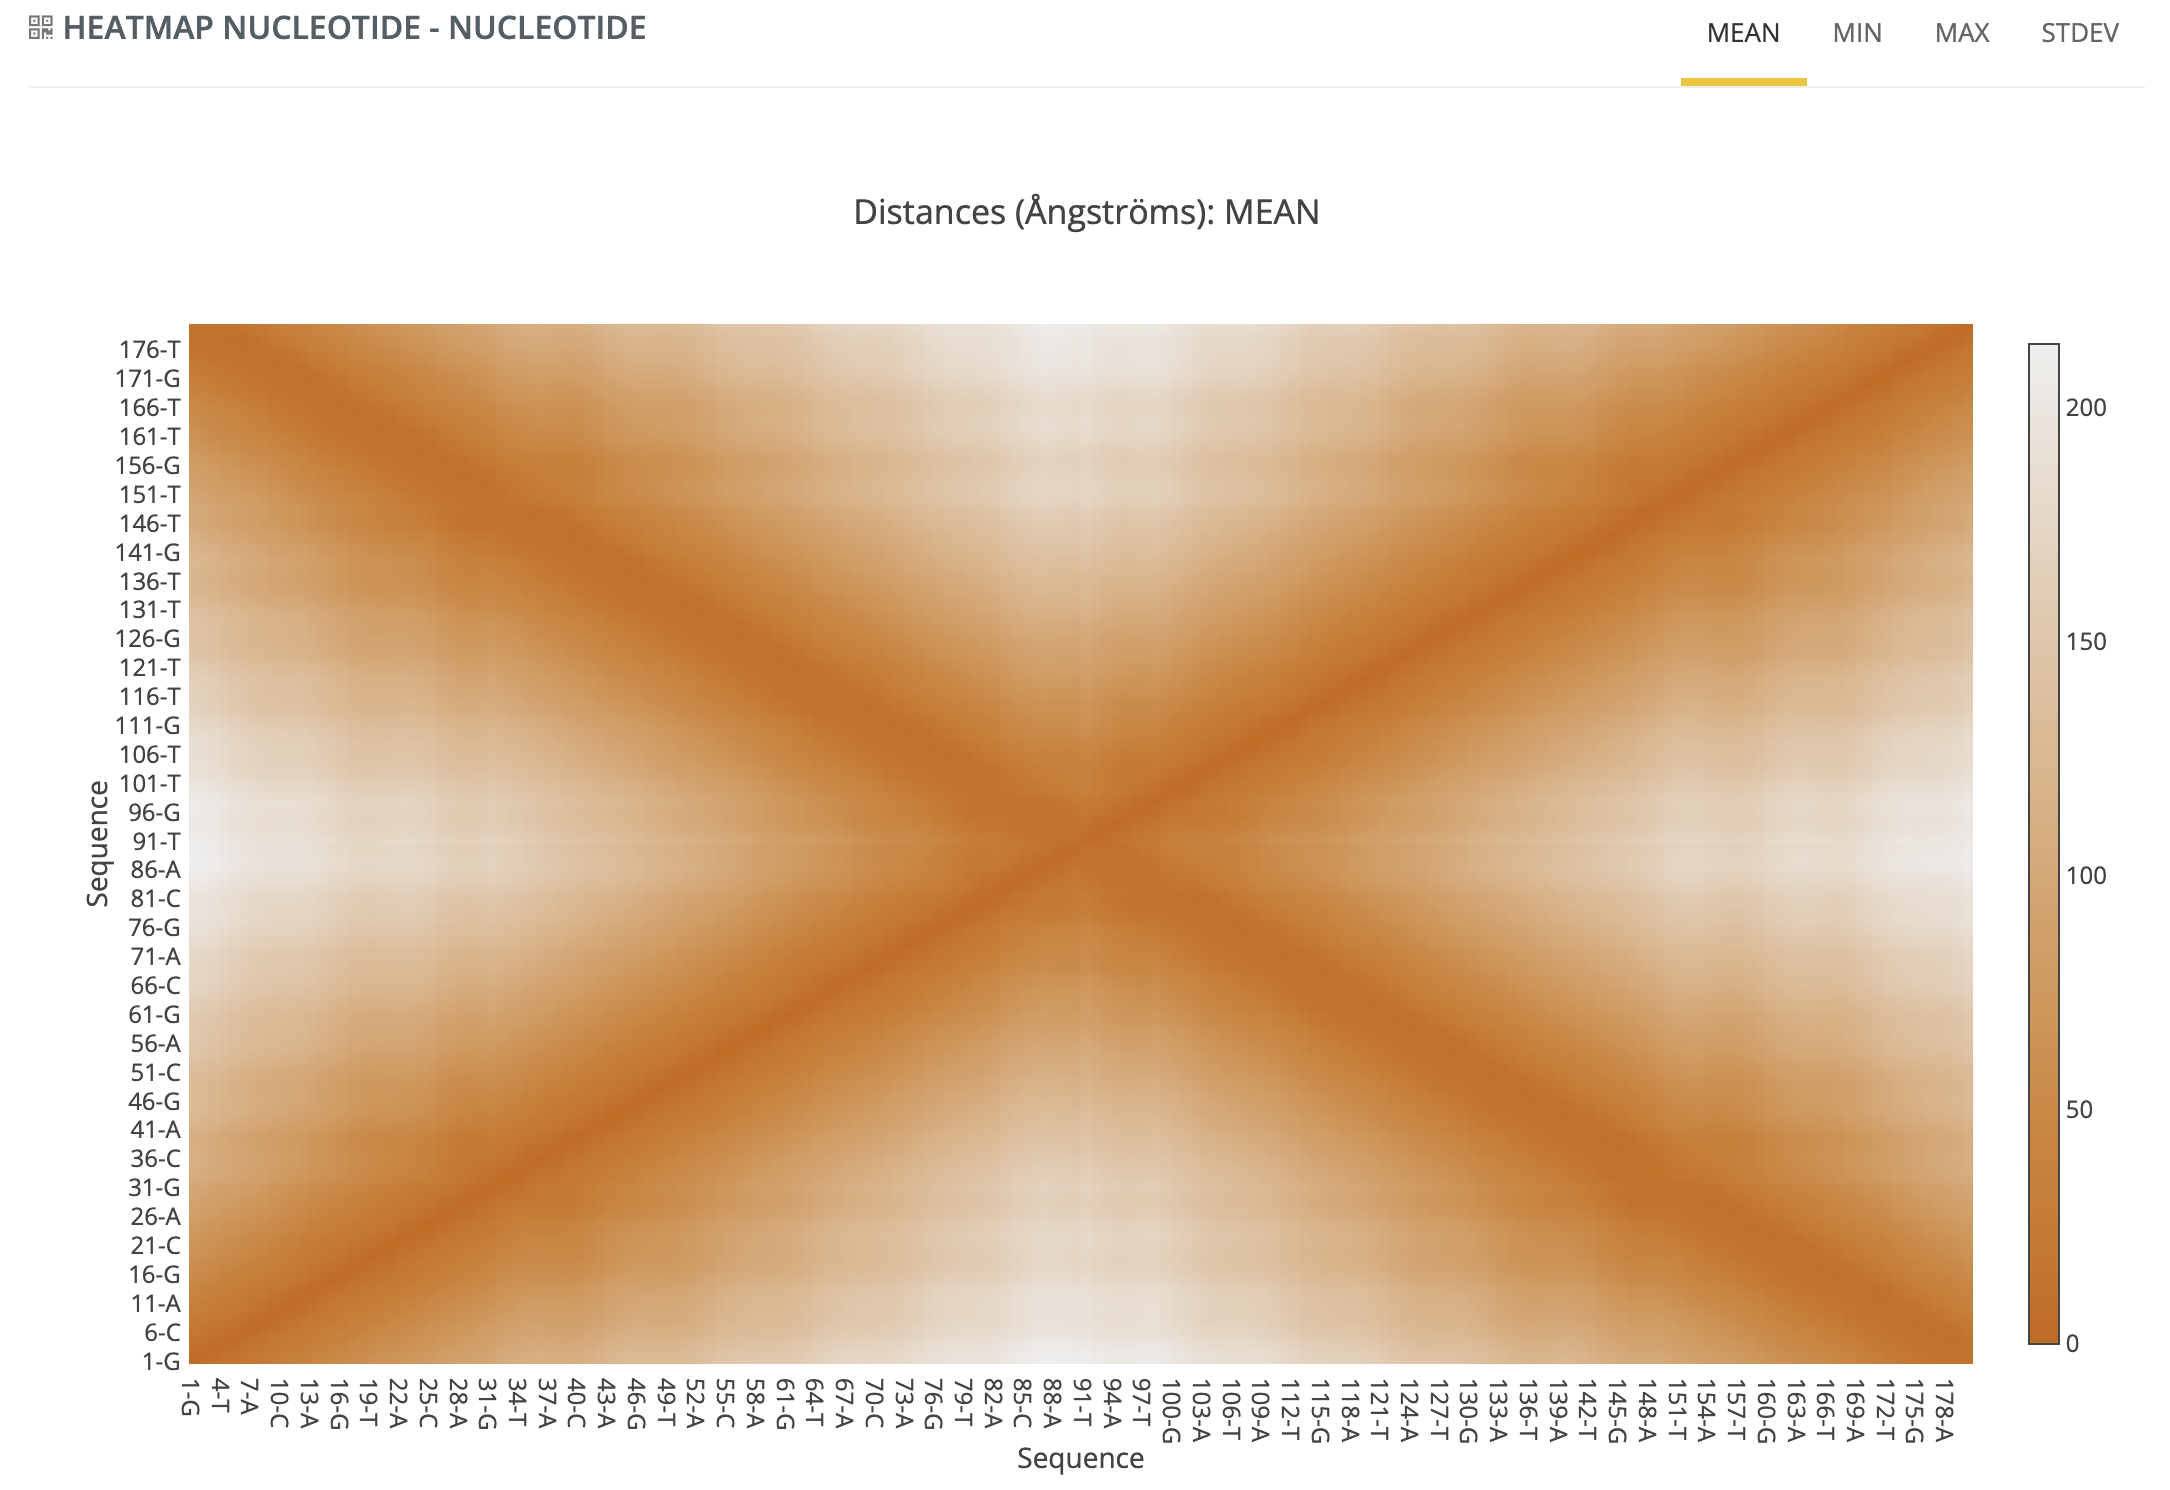
Nucleotide - Nucleotide
Distances for all pairs of nucleotides (all against all) in the sequence are computed in all methods offered by CGeNArate server. When the type of simulation chosen is a trajectory generation, 4 different plots will be presented, using the distances found analysing all the snapshots in the trajectory. The four plots are: Mean (distances mean along the trajectory), Min (minimum distance found for the particular nucleotide pair in all the structures of the trajectory), Max (maximum distance found for the particular nucleotide pair in all the structures of the trajectory), and Stdev (distance standard deviation found along the trajectory).
Protein - Nucleotide
Results for the CGeNArateWeb + Proteins tool generate two specific sub-sections in the Contacts analysis: Protein-Nucleotide and Protein-Protein distances. In these cases, four different plots are computed for the trajectory and showed in each of the sub-sections when a protein (or two proteins in the Protein-Protein case) is selected.
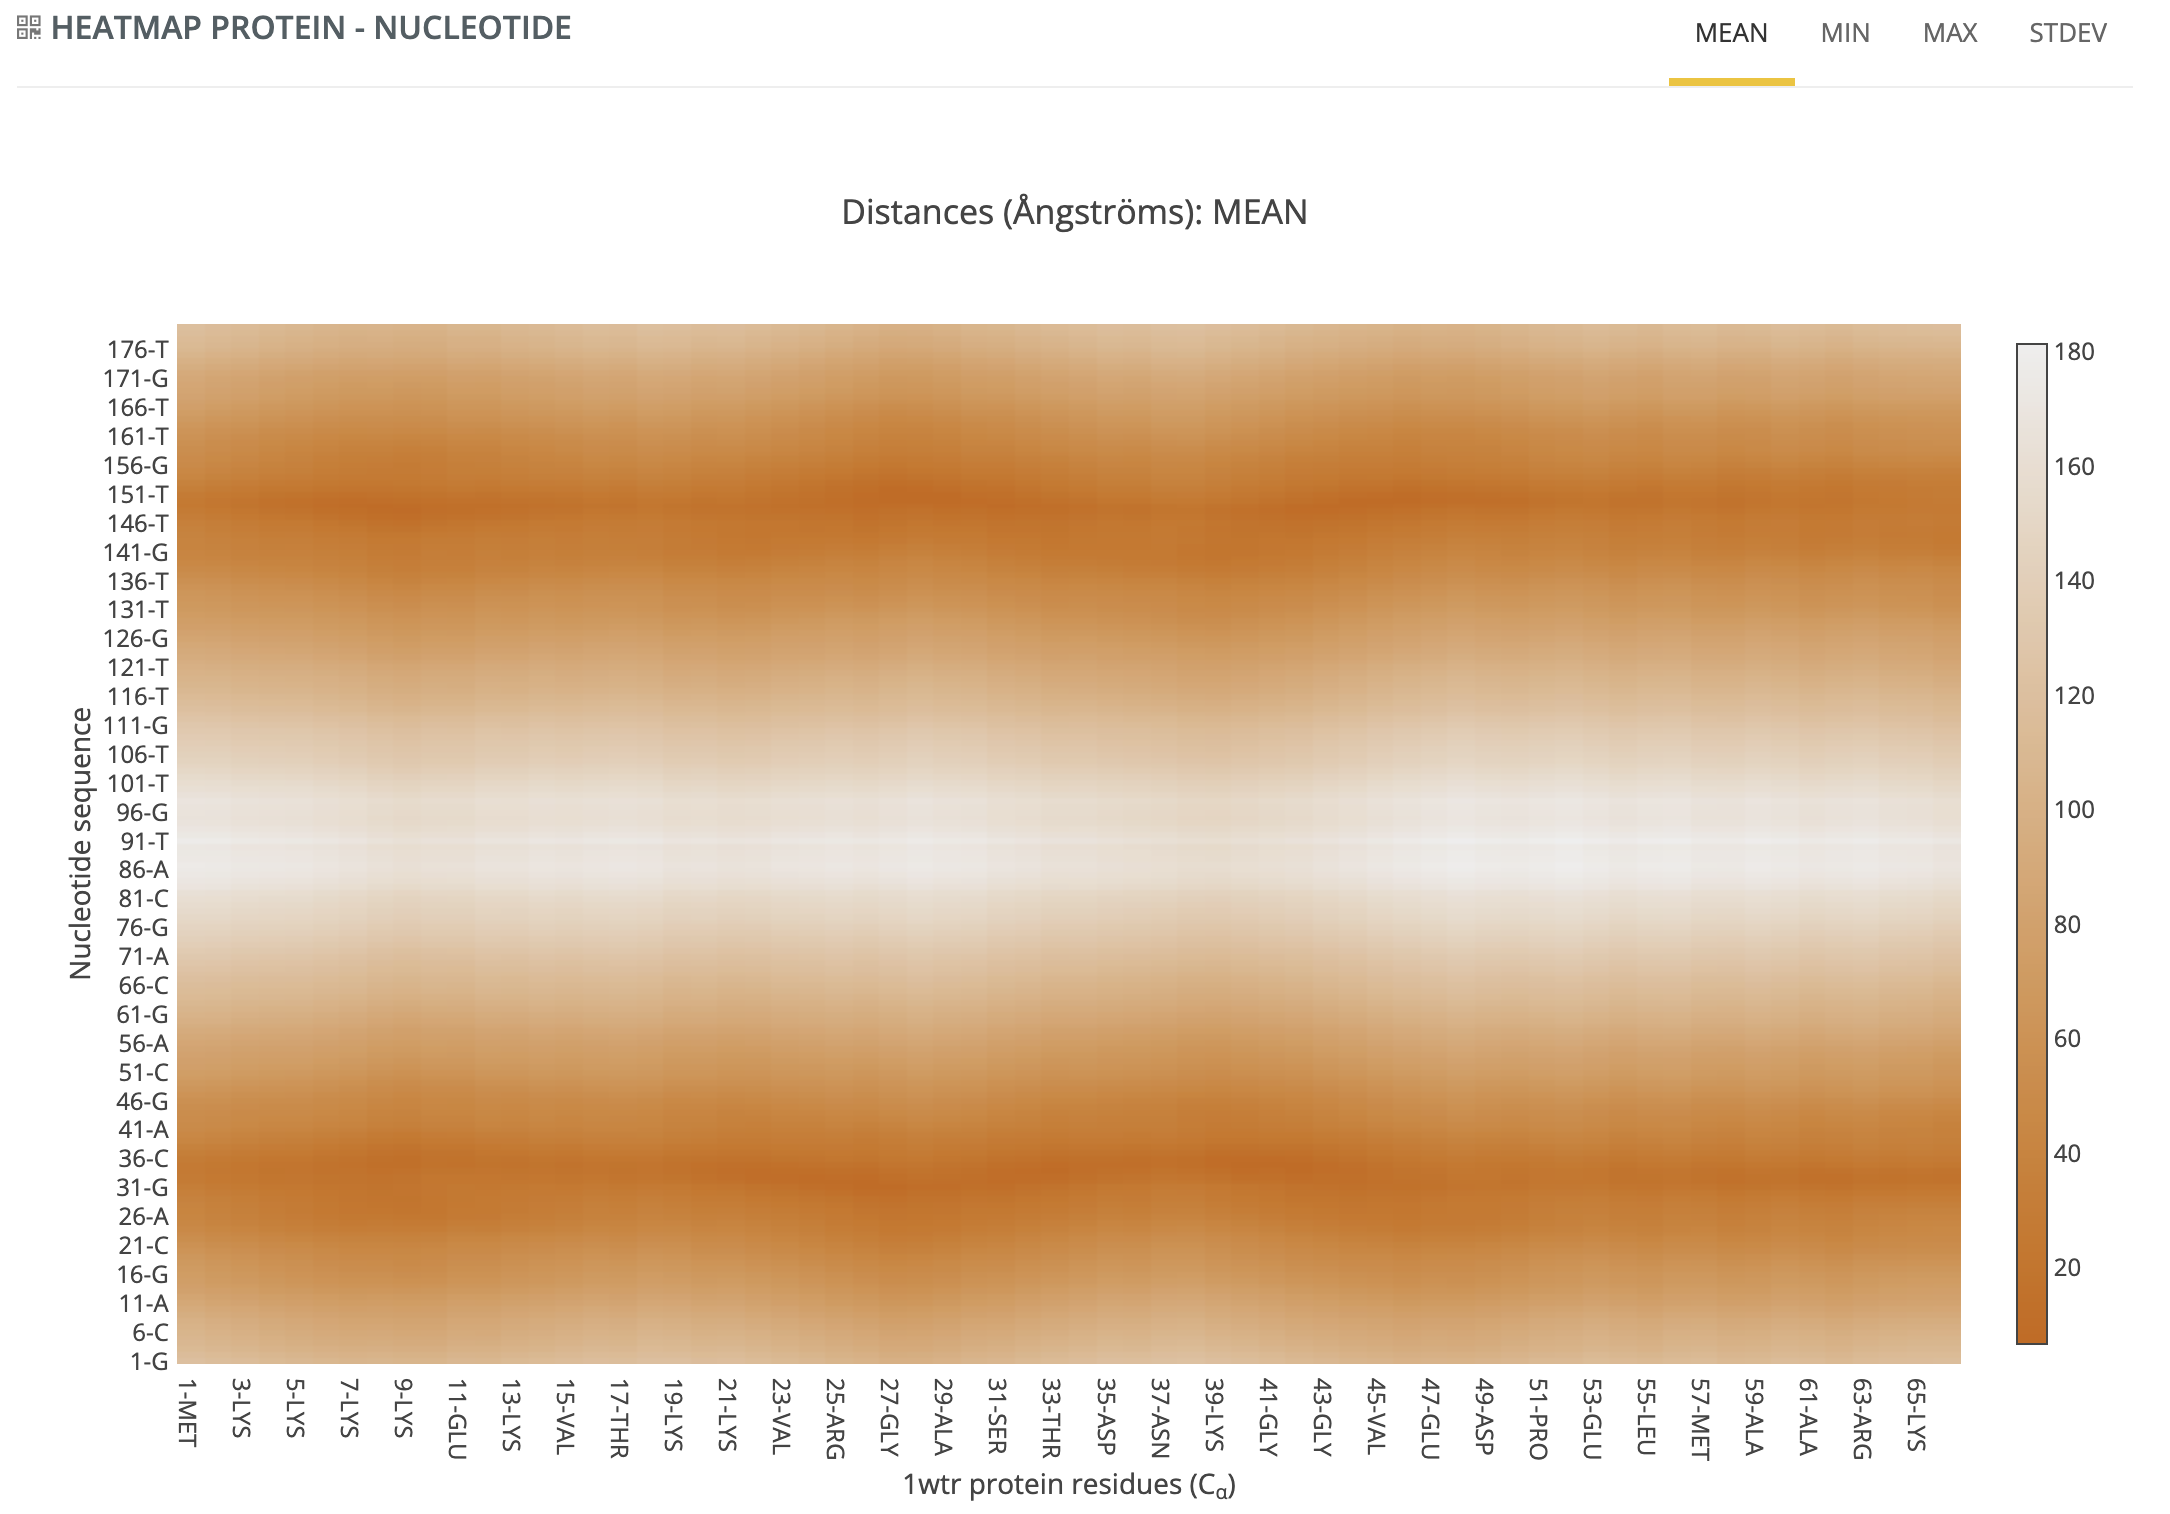
Distances shown in the Protein-Nucleotide section correspond to the distances between the selected protein and the nucleotide
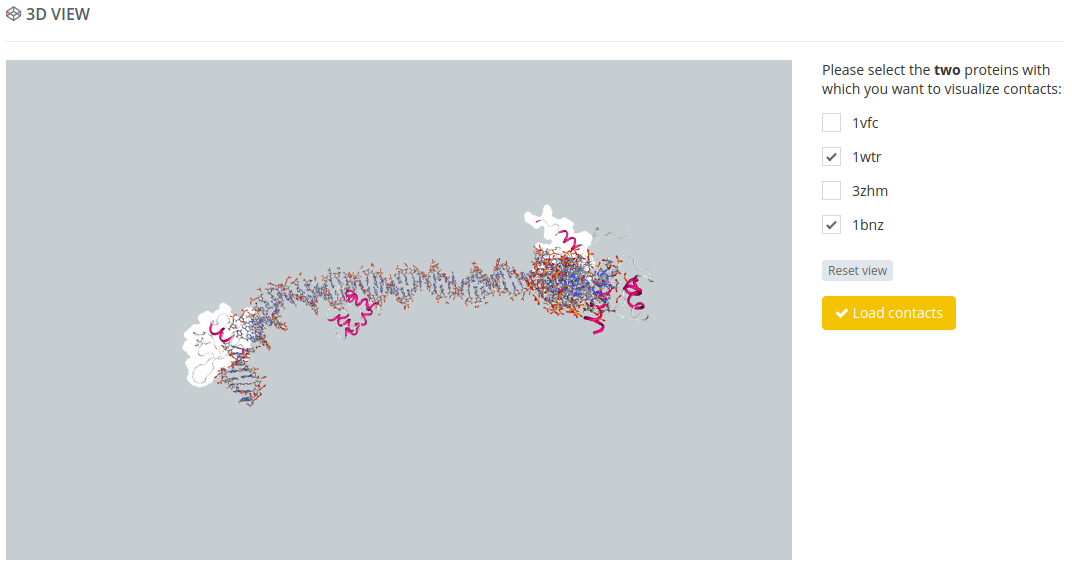
To view these plots, users first have to select the desired protein from a list of all the proteins selected for the simulation in the input section of the server. To help the user, a 3D view of the nucleic structure together with the the proteins is shown using NGL viewer.
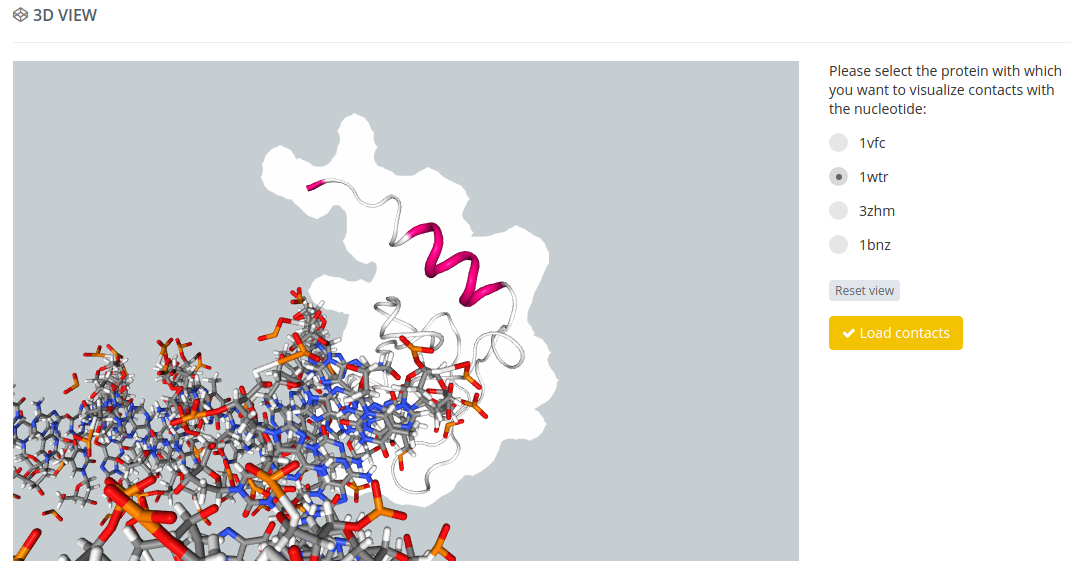
After selecting the protein and clicking the Load contacts button, the heatmap plot corresponding to the distances between the protein and the nucleotides will be shown.
Proteincα - Proteincα
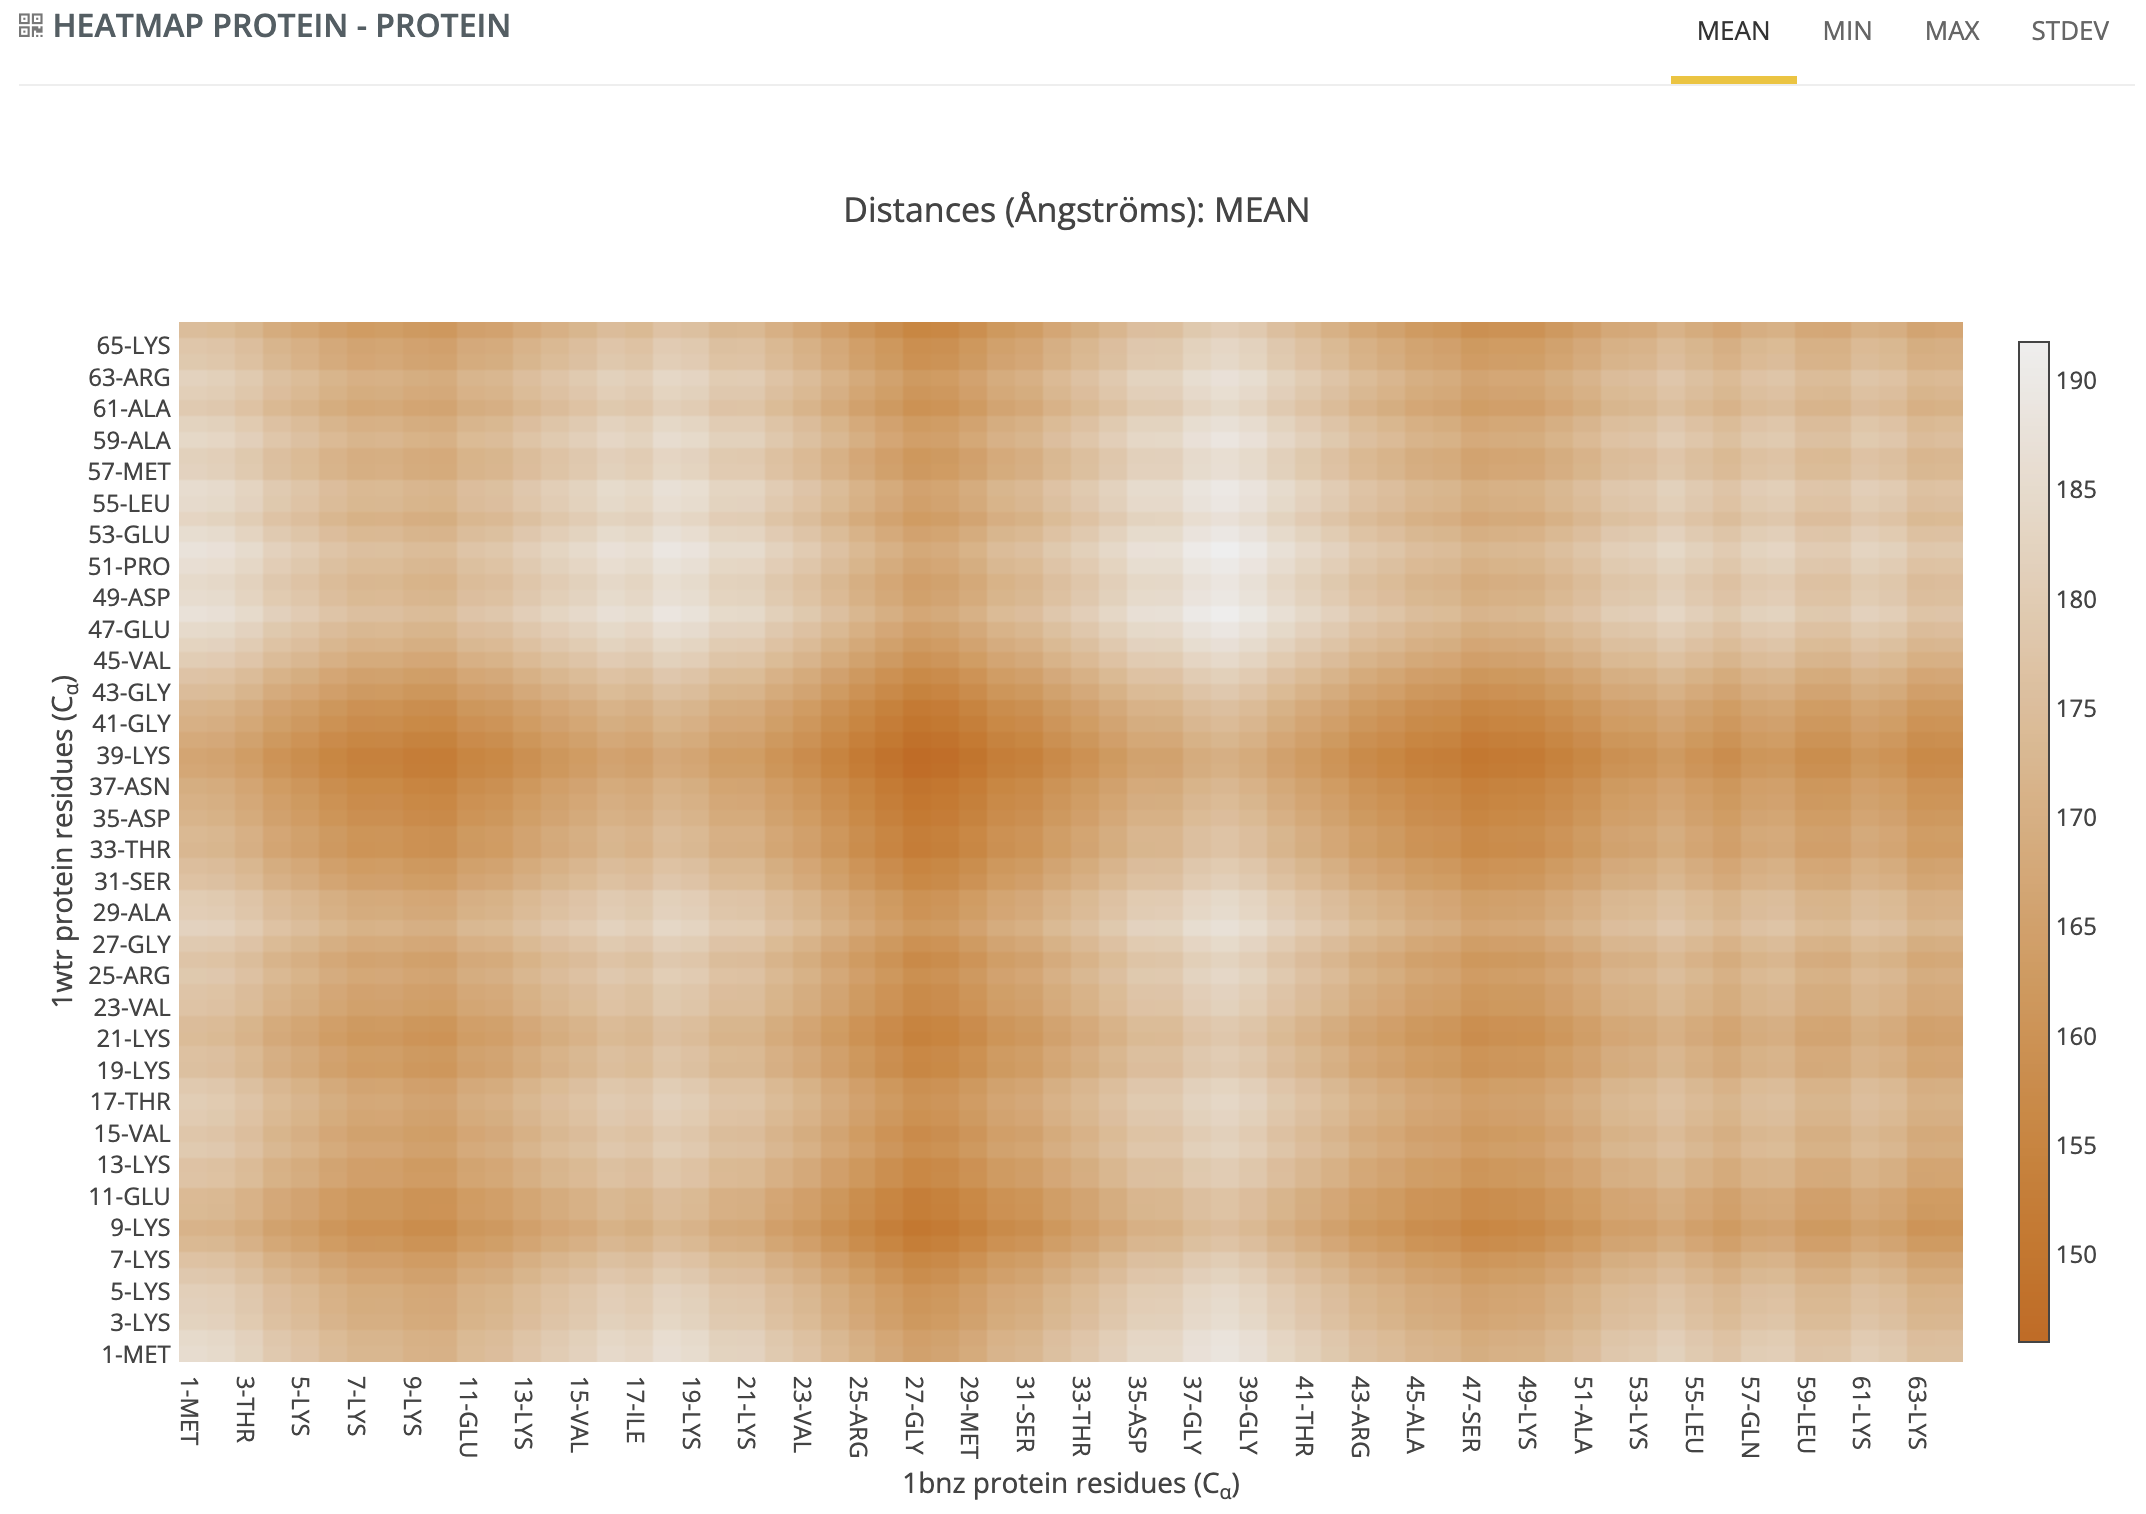
Distances shown in the Proteincα - Proteincα section correspond to the distances between the two selected proteins
To view these plots, users first have to select the two desired proteins from a list of all the proteins selected for the simulation in the input section of the server. To help the user, a 3D view of the nucleic structure together with the proteins is shown using NGL viewer.
After selecting the proteins and clicking the Load contacts button, the heatmap plot corresponding to the distances between both proteins will be shown.
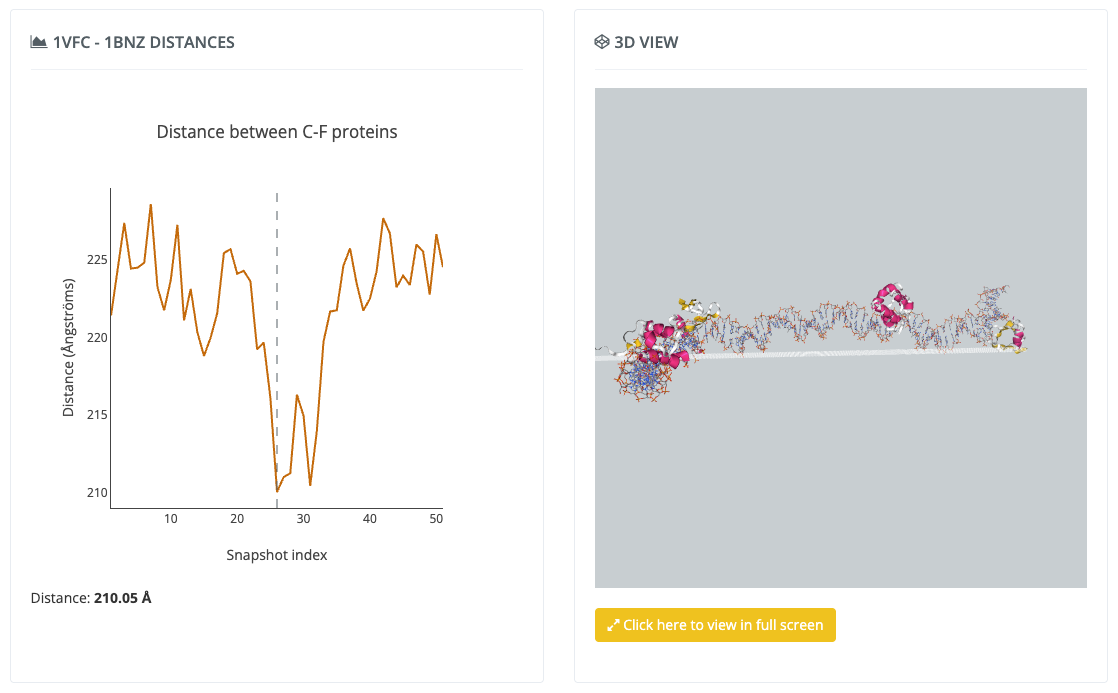
Protein - Protein
Distances shown in the Protein - Protein section correspond to the distances between the two selected proteins
To view these plots, users first have to select the two desired proteins from a list of all the proteins selected for the simulation in the input section of the server. To help the user, a 3D view of the nucleic structure together with the proteins is shown using NGL viewer.
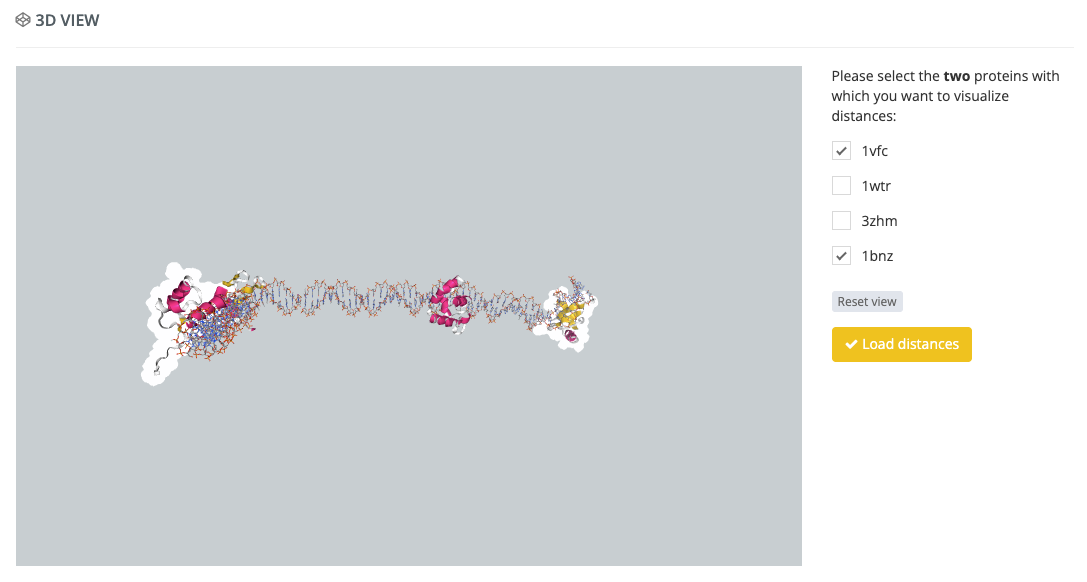
After selecting the proteins and clicking the Load distances button, the plot corresponding to the distances between both proteins will be shown. Additionally, a new 3D view with the distances is shown as well at right. The interface offers an interactive way to switch between the snapshots of the trajectory by selecting the snapshot either in the plot, which is ordered according to the index of each snapshot in the trajectory. When selecting a distance/snapshot the corresponding structure with its distance is shown with the NGL viewer.