CGeNArateWeb Help - Analysis Curves
Using Curves+, CGeNArateWeb offers a complete study of Nucleic Acids Helical Parameters:
- Axis Base Pairs :: Method - Results
- Inter-Base Pairs :: Method - Results
- Grooves :: Method - Results
Axis Base Pair
Method
Nucleotide Base pairs, the DNA building blocks, are made of two nucleobases bound to each other by hydrogen bonds.
The major elements of flexibility in the DNA base pairs when we consider them as a blocks (movements of the whole base pair) are divided in two types: Translational (x/y-displacement) and rotational (inclination, tip) parameters.
- X-displacement: Translation around the X-axis.
- Y-displacement: Translation around the Y-axis.
- Inclination: Rotation around the X-axis.
- Tip: Rotation around the Y-axis.

Results
Axis Base Pair analyses are shown in a set of line plots. The parameter value (average value + standard deviation in the trajectory) is represented with a blue point-line (y-axis) for each of the nucleotides along the input sequence (x-axis).
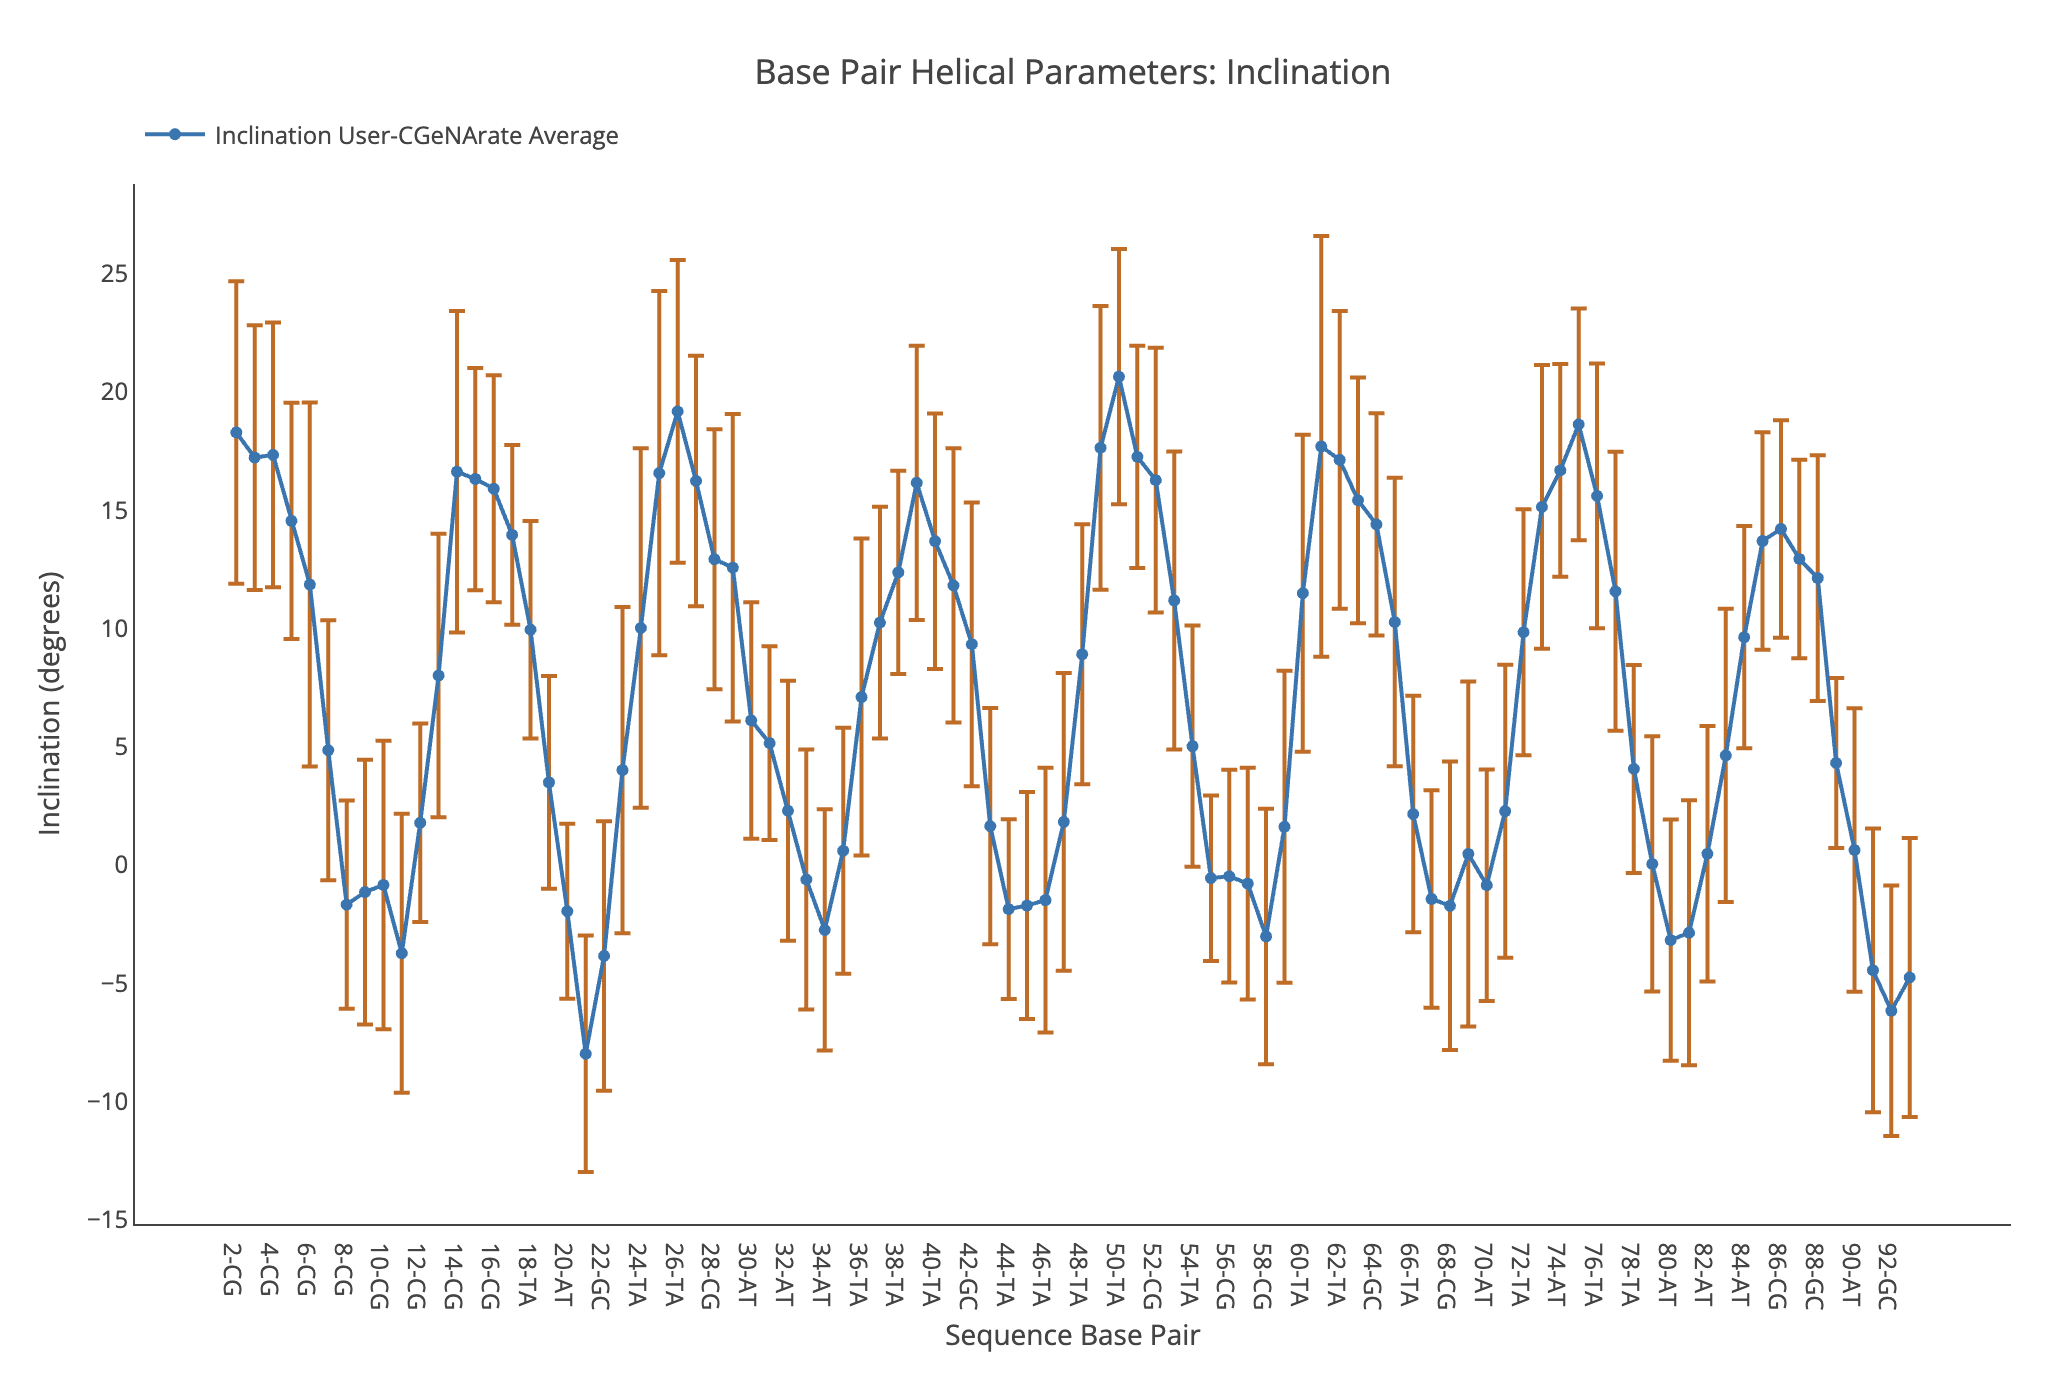
Inclination
Inclination average value, together with its associated standard deviation (for trajectories) is shown for each of the nucleotides in the sequence in a blue point-line. Y-axis: Inclination value in degrees, X-axis: Sequence base pairs.
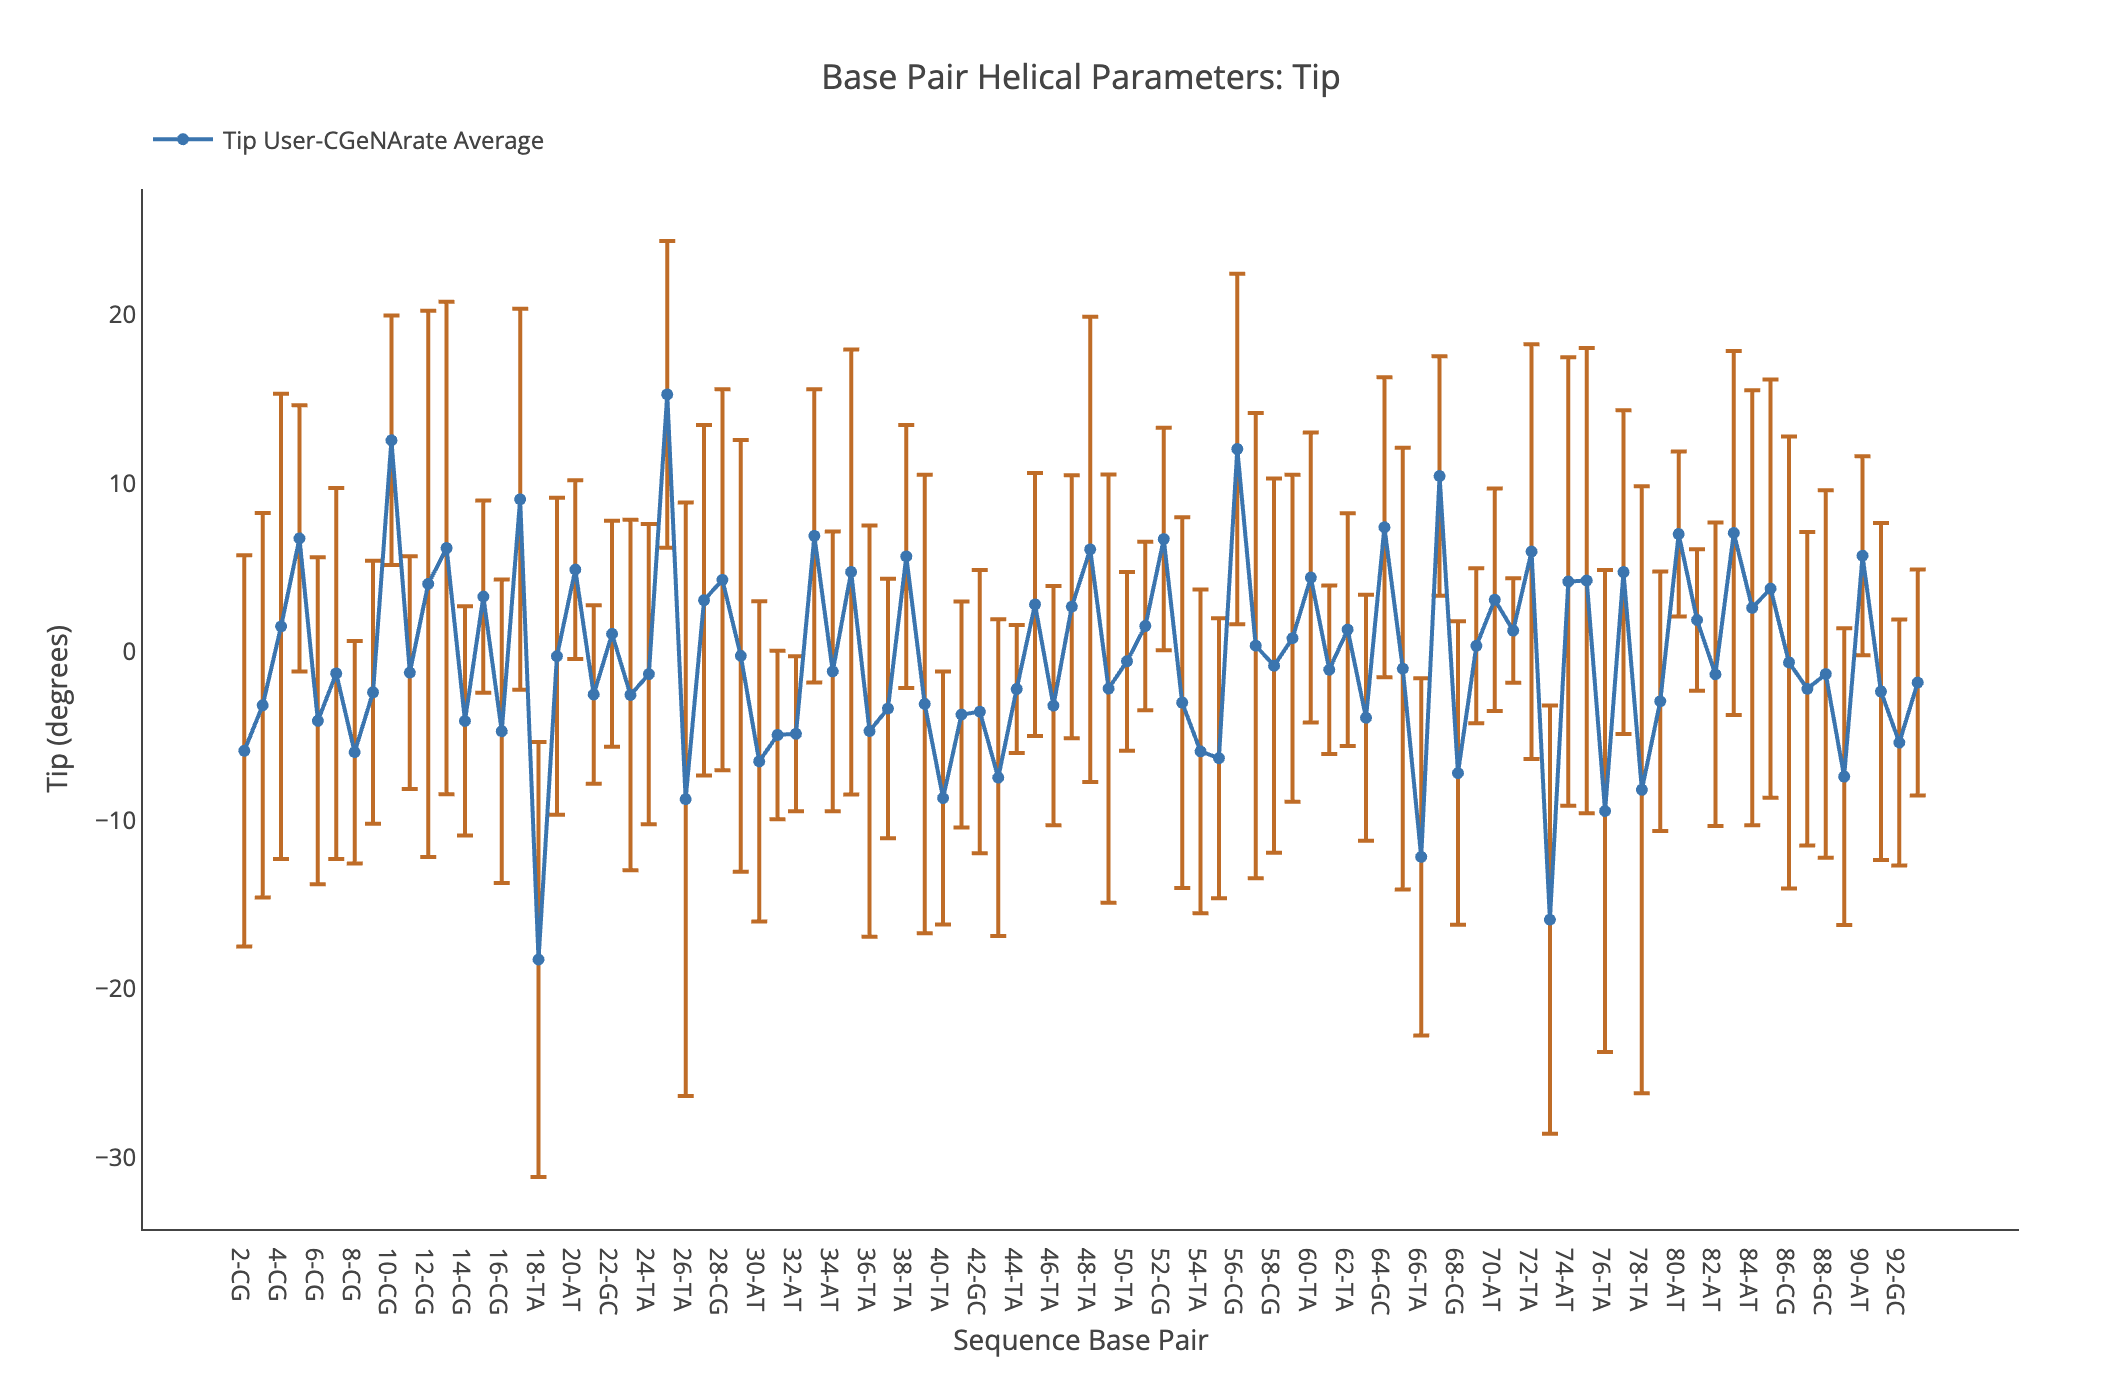
Tip
Tip average value, together with its associated standard deviation (for trajectories) is shown for each of the nucleotides in the sequence in a blue point-line. Y-axis: Tip value in degrees, X-axis: Sequence base pairs.
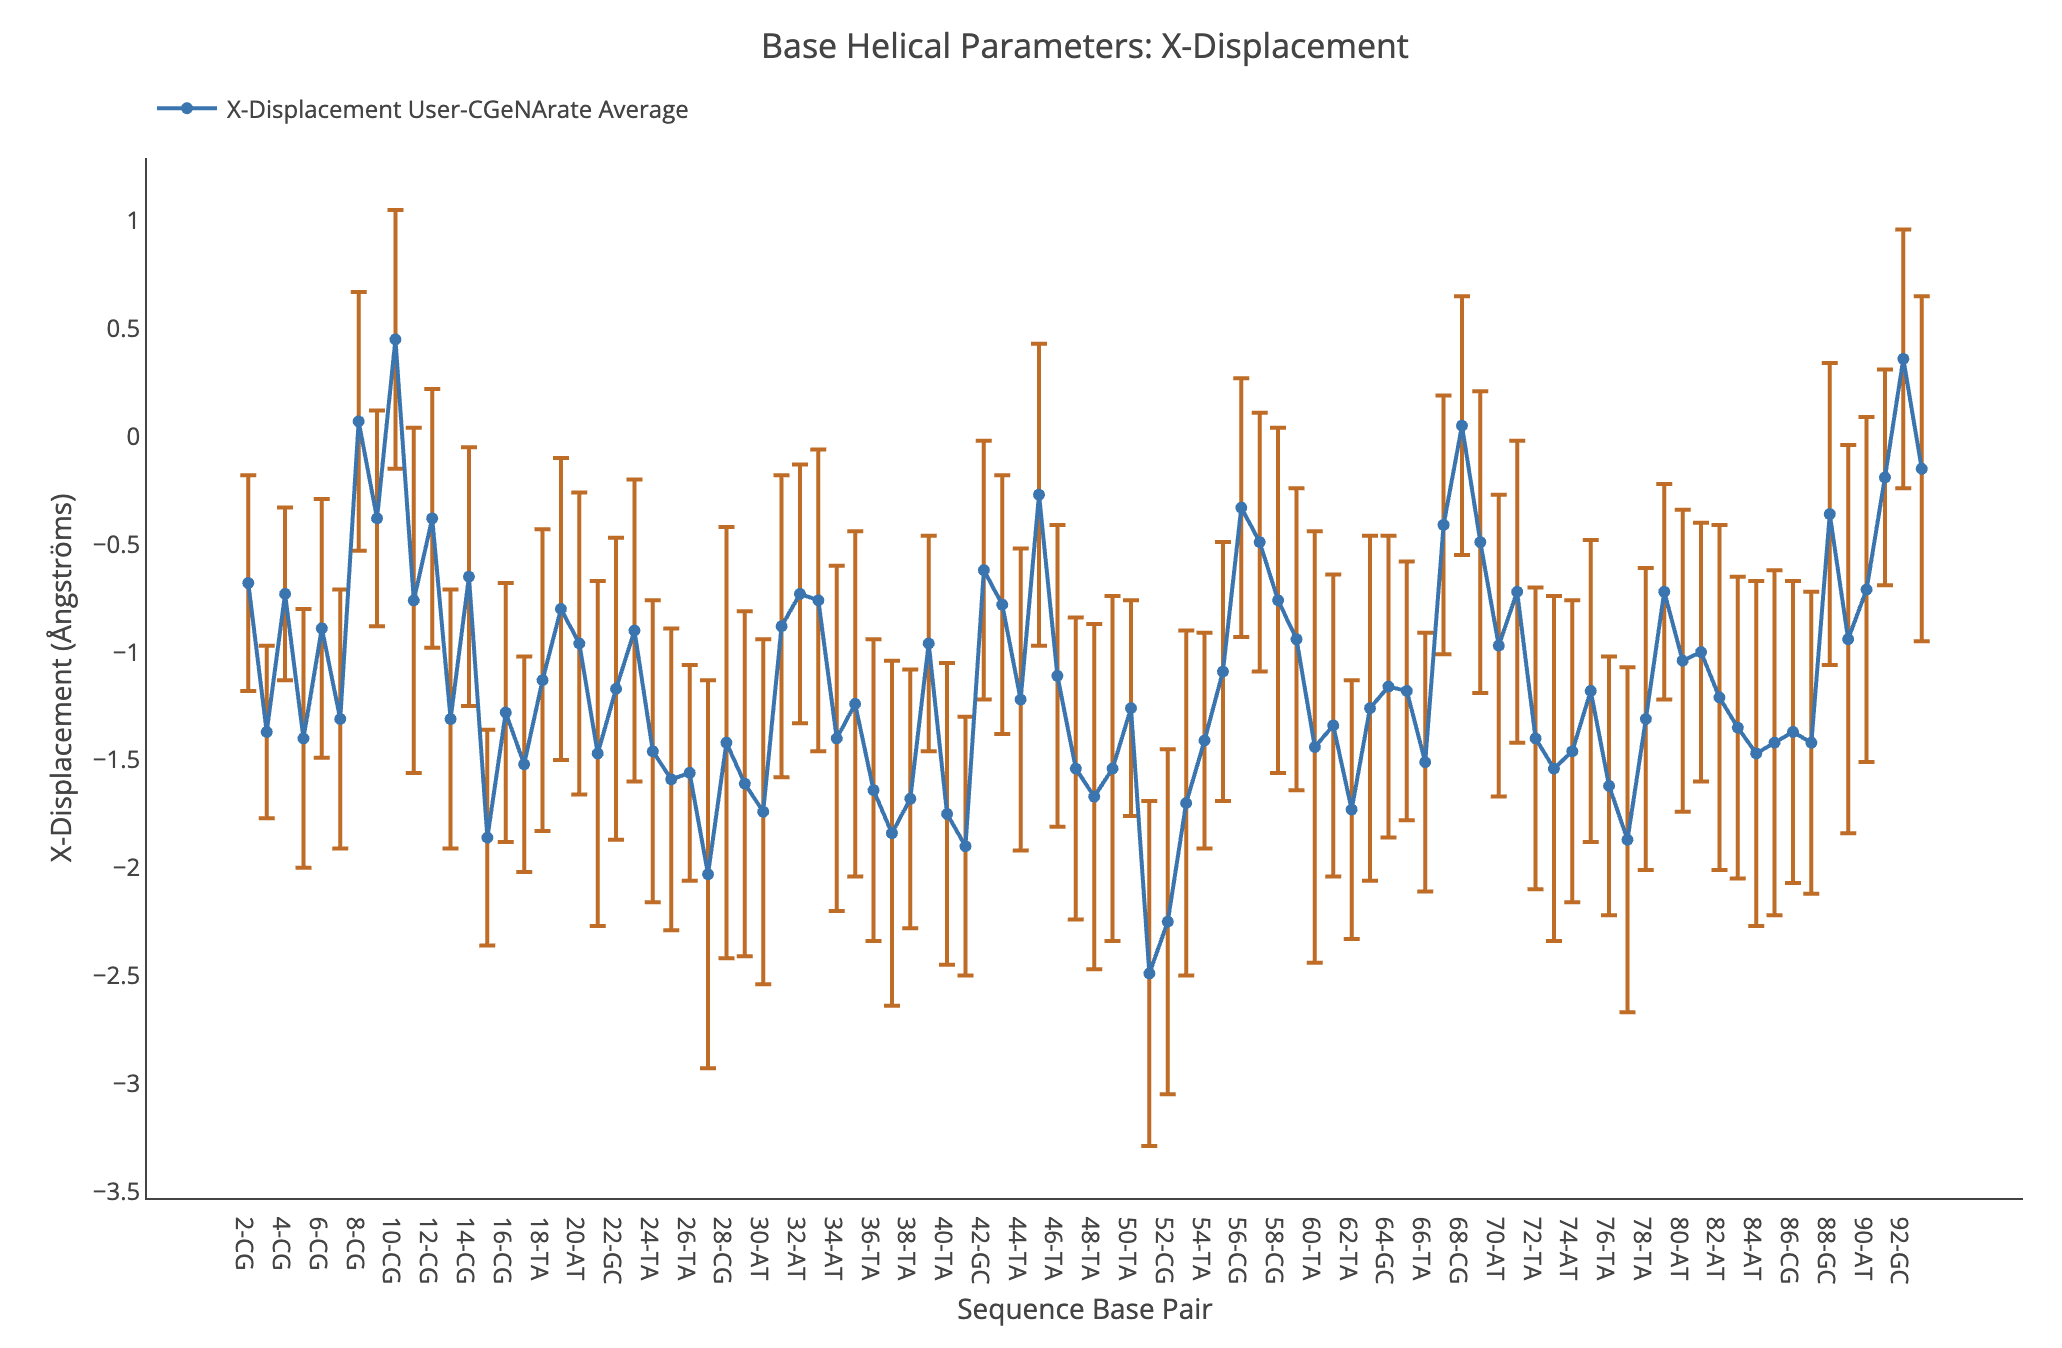
X-displacement
X-displacement average value, together with its associated standard deviation (for trajectories) is shown for each of the nucleotides in the sequence in a blue point-line. Y-axis: X-displacement value in Angstroms, X-axis: Sequence base pairs.
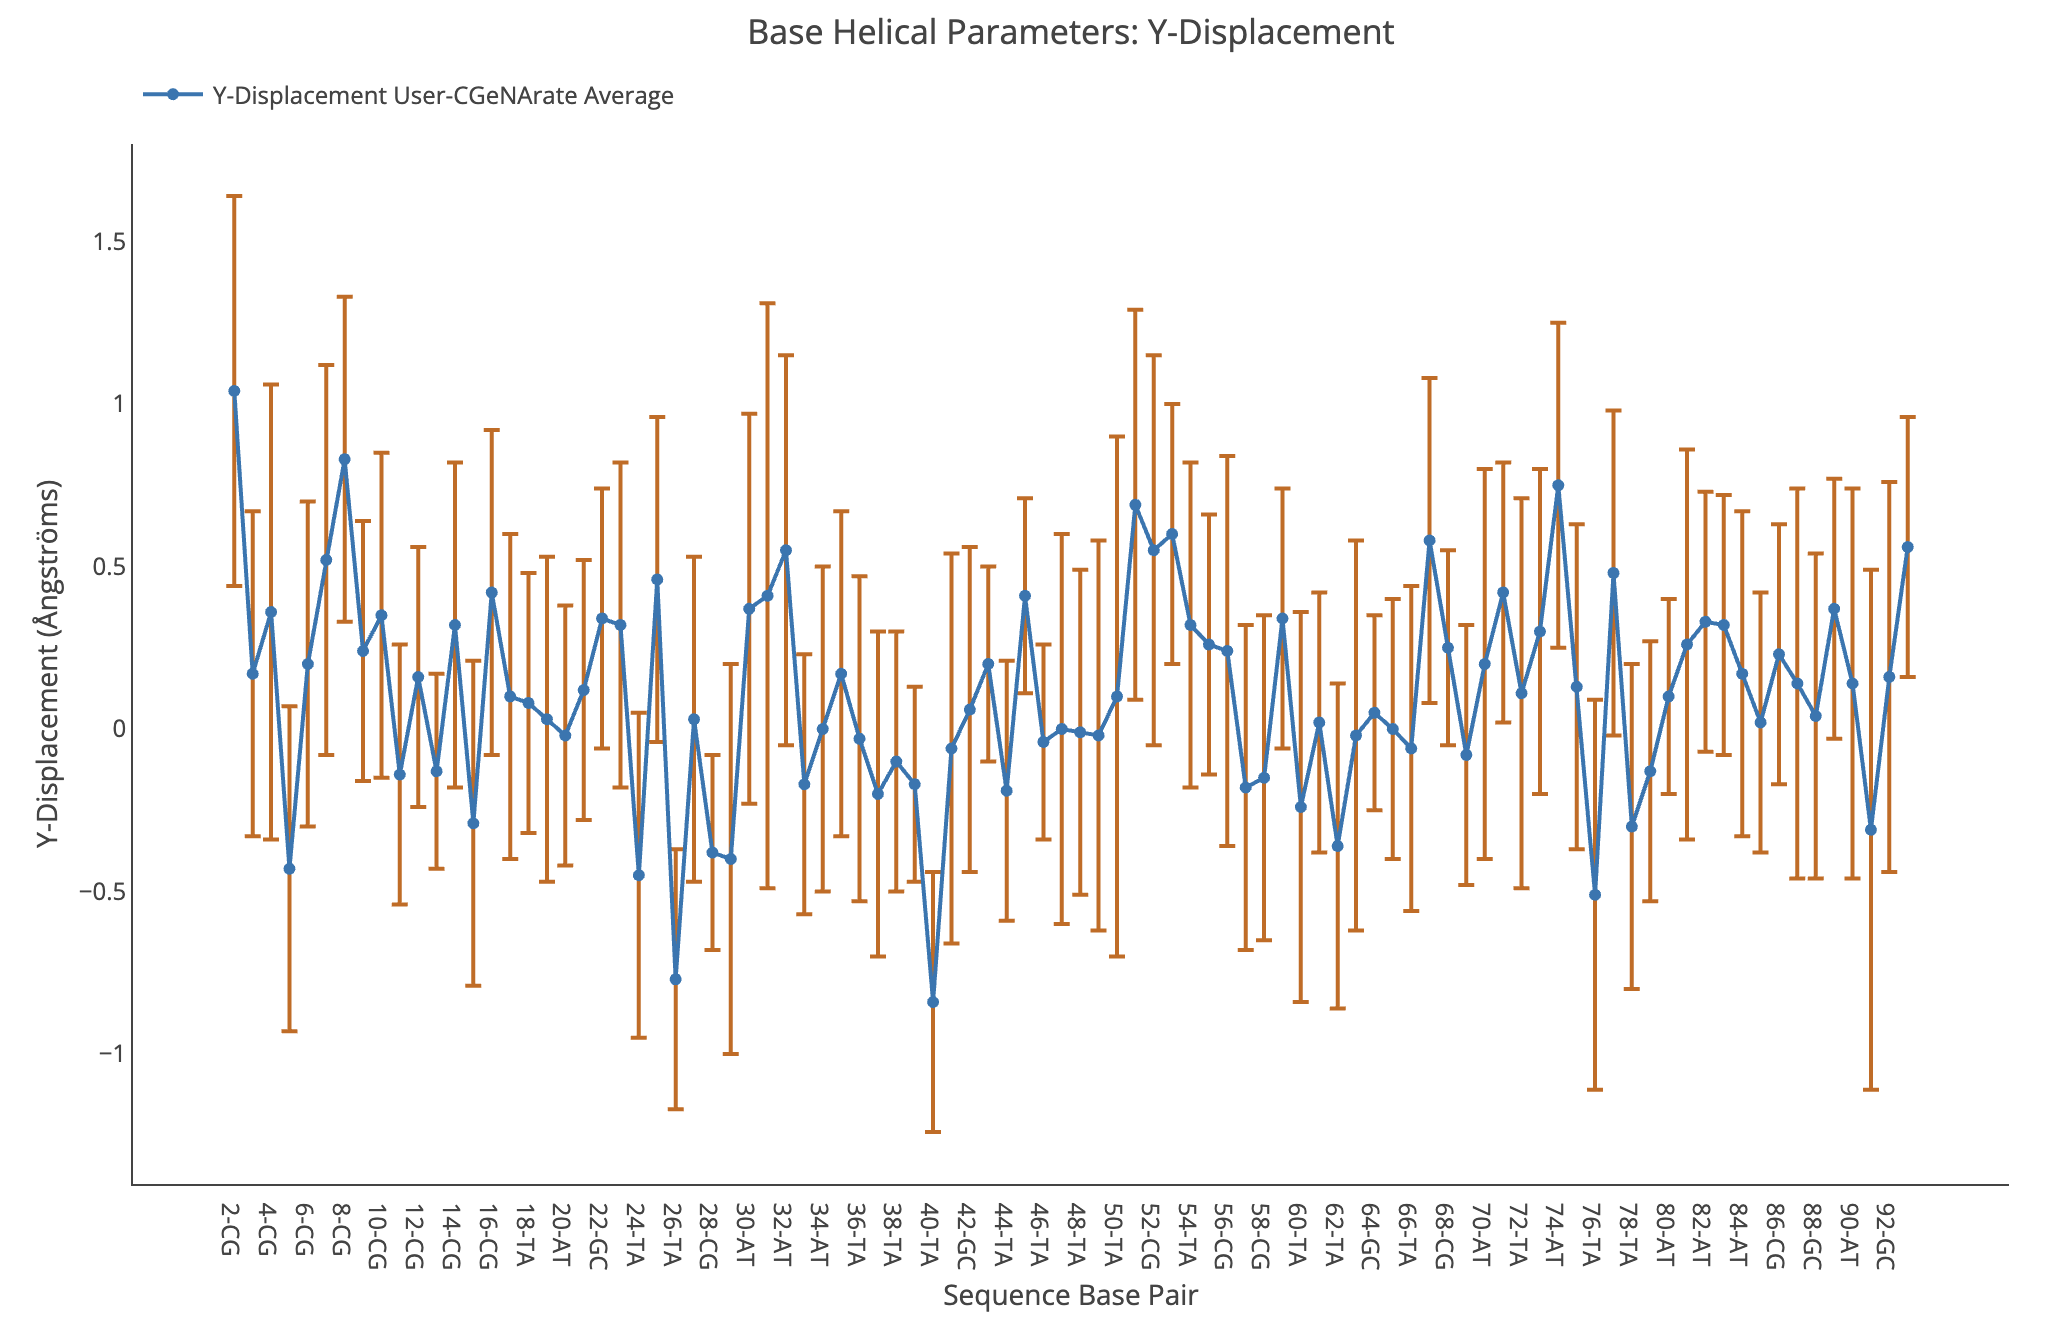
Y-displacement
Y-displacement average value, together with its associated standard deviation (for trajectories) is shown for each of the nucleotides in the sequence in a blue point-line. Y-axis: Y-displacement value in Angstroms, X-axis: Sequence base pairs.
Inter Base Pair
Method
Nucleotide Base pair steps, build by two adjacent base pairs (two base pairs, four nucleotides -two from one strand, two from the other strand-), are the DNA blocks that characterize the helical structure of the molecule. Changes in the helical parameters (described in the following sections) of these base pair steps can be used to describe disruptions in a DNA structure.
The major elements of flexibility in the DNA base pair steps when we consider them as a two elements interacting to each other (movements of a base pair with respect to adjacent base pair) can be divided again in two different types: Translational (Shift, Slide, Rise) and rotational (Tilt, Roll, Twist) parameters.
- Shift: Translation around the X-axis.
- Slide: Translation around the Y-axis.
- Rise: Translation around the Z-axis.
- Tilt: Rotation around the X-axis.
- Roll: Rotation around the Y-axis.
- Twist: Rotation around the Z-axis.

Results
Inter Base Pair analyses are shown in a set of line plots. The parameter value (average value + standard deviation in the trajectory) is represented with a blue point-line (y-axis) for each of the base pair steps along the input sequence (x-axis).
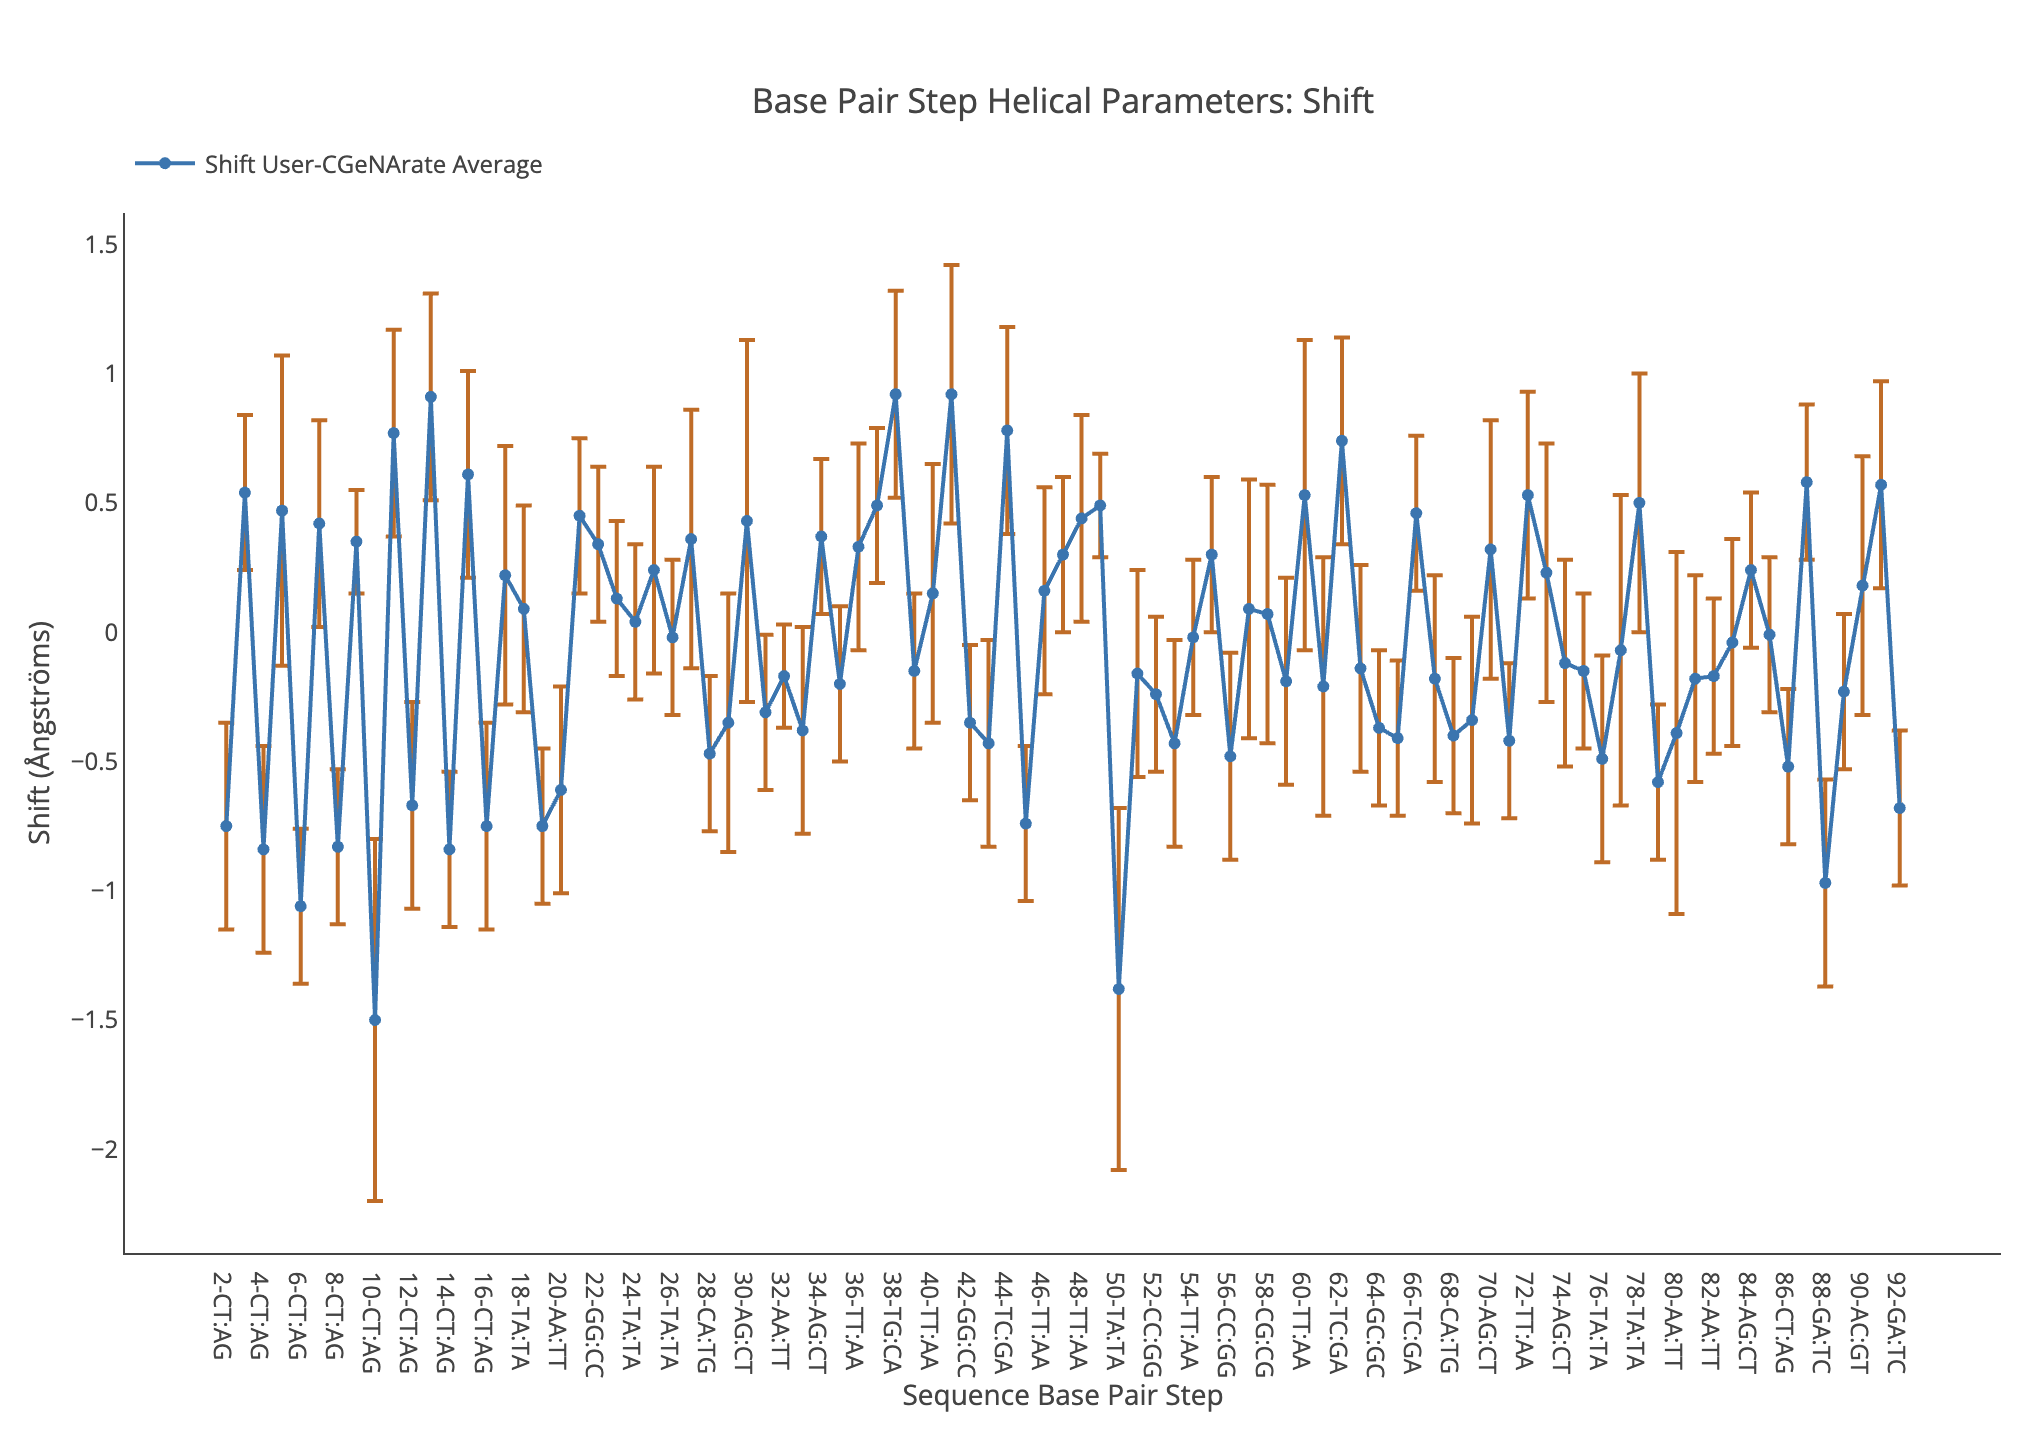
Shift
Shift average value, together with its associated standard deviation (for trajectories) is shown for each of the base pair steps in the sequence in a blue point-line. Y-axis: Shift value in Angstroms, X-axis: Sequence base pair steps.
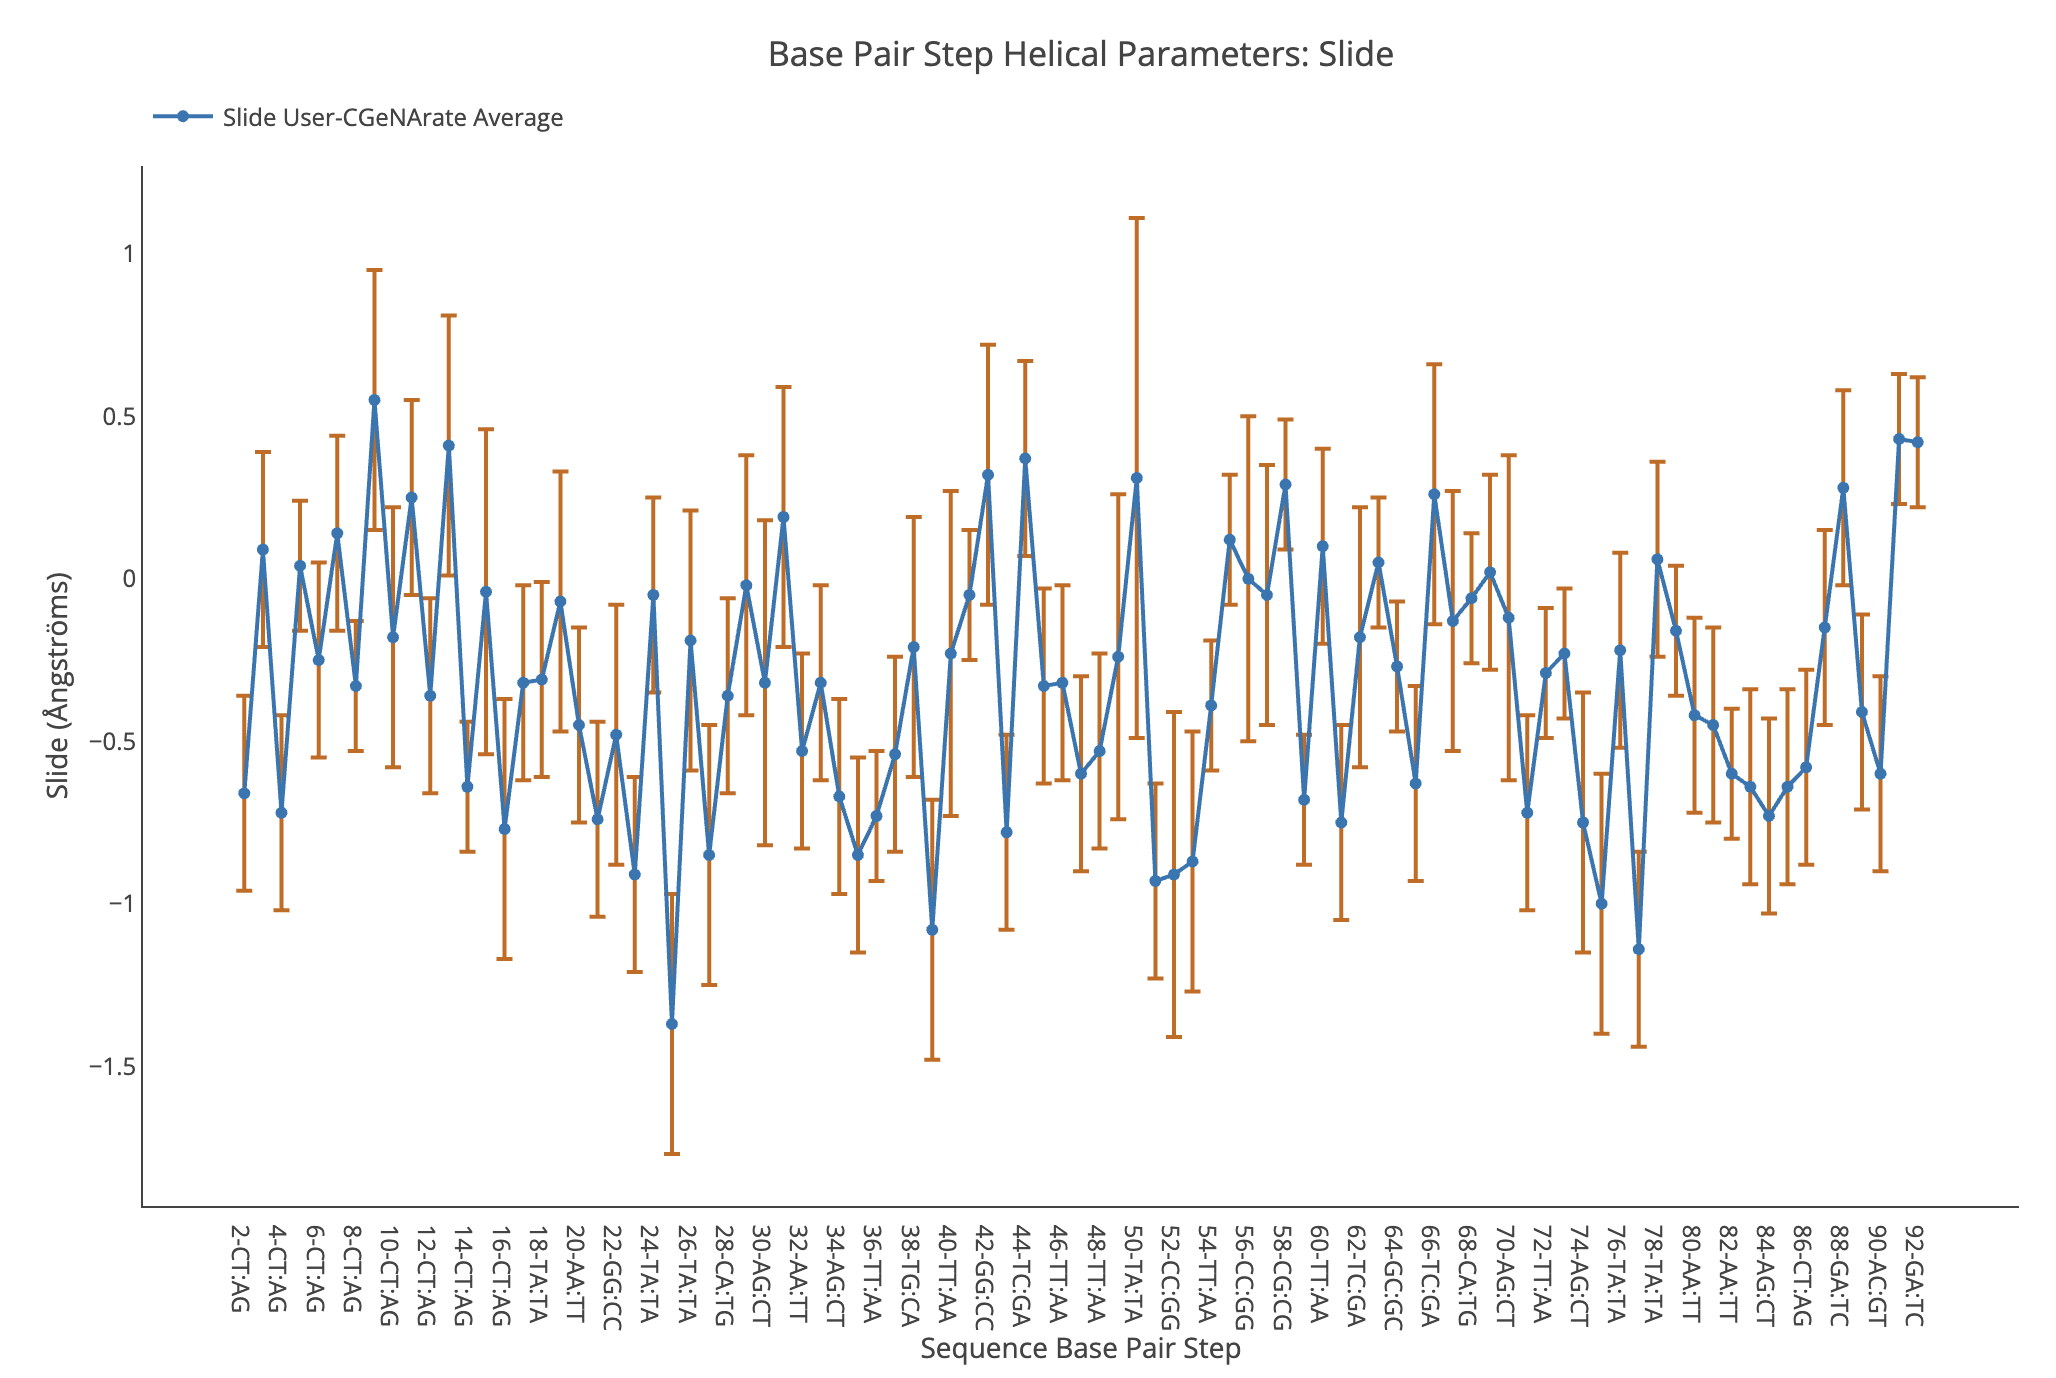
Slide
Slide average value, together with its associated standard deviation (for trajectories) is shown for each of the base pair steps in the sequence in a blue point-line. Y-axis: Slide value in Angstroms, X-axis: Sequence base pair steps.
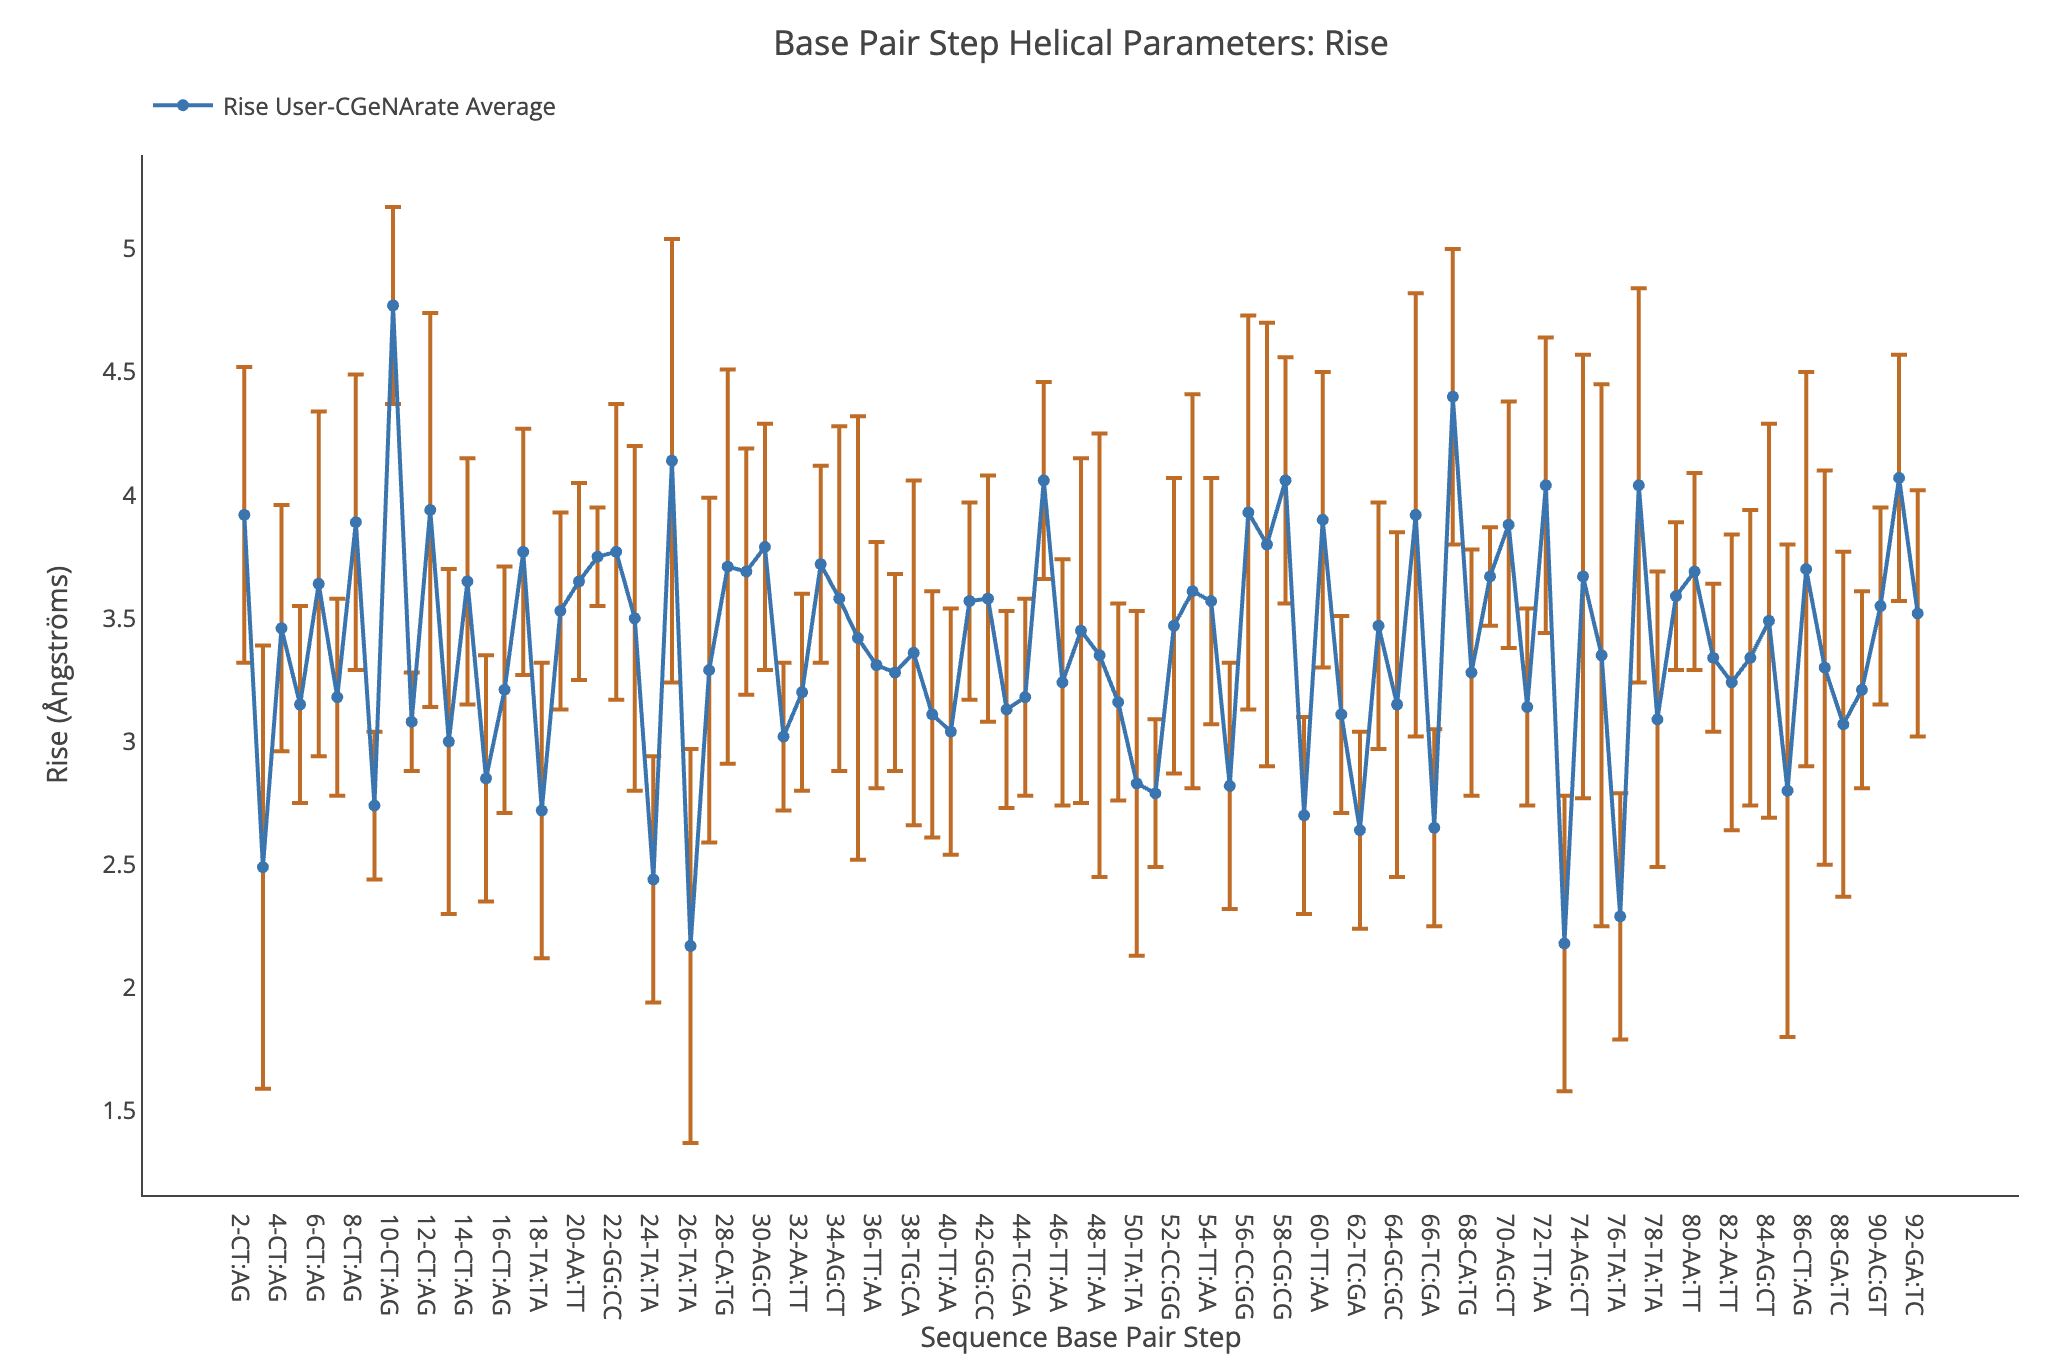
Rise
Rise average value, together with its associated standard deviation (for trajectories) is shown for each of the base pair steps in the sequence in a blue point-line. Y-axis: Rise value in Angstroms, X-axis: Sequence base pair steps.
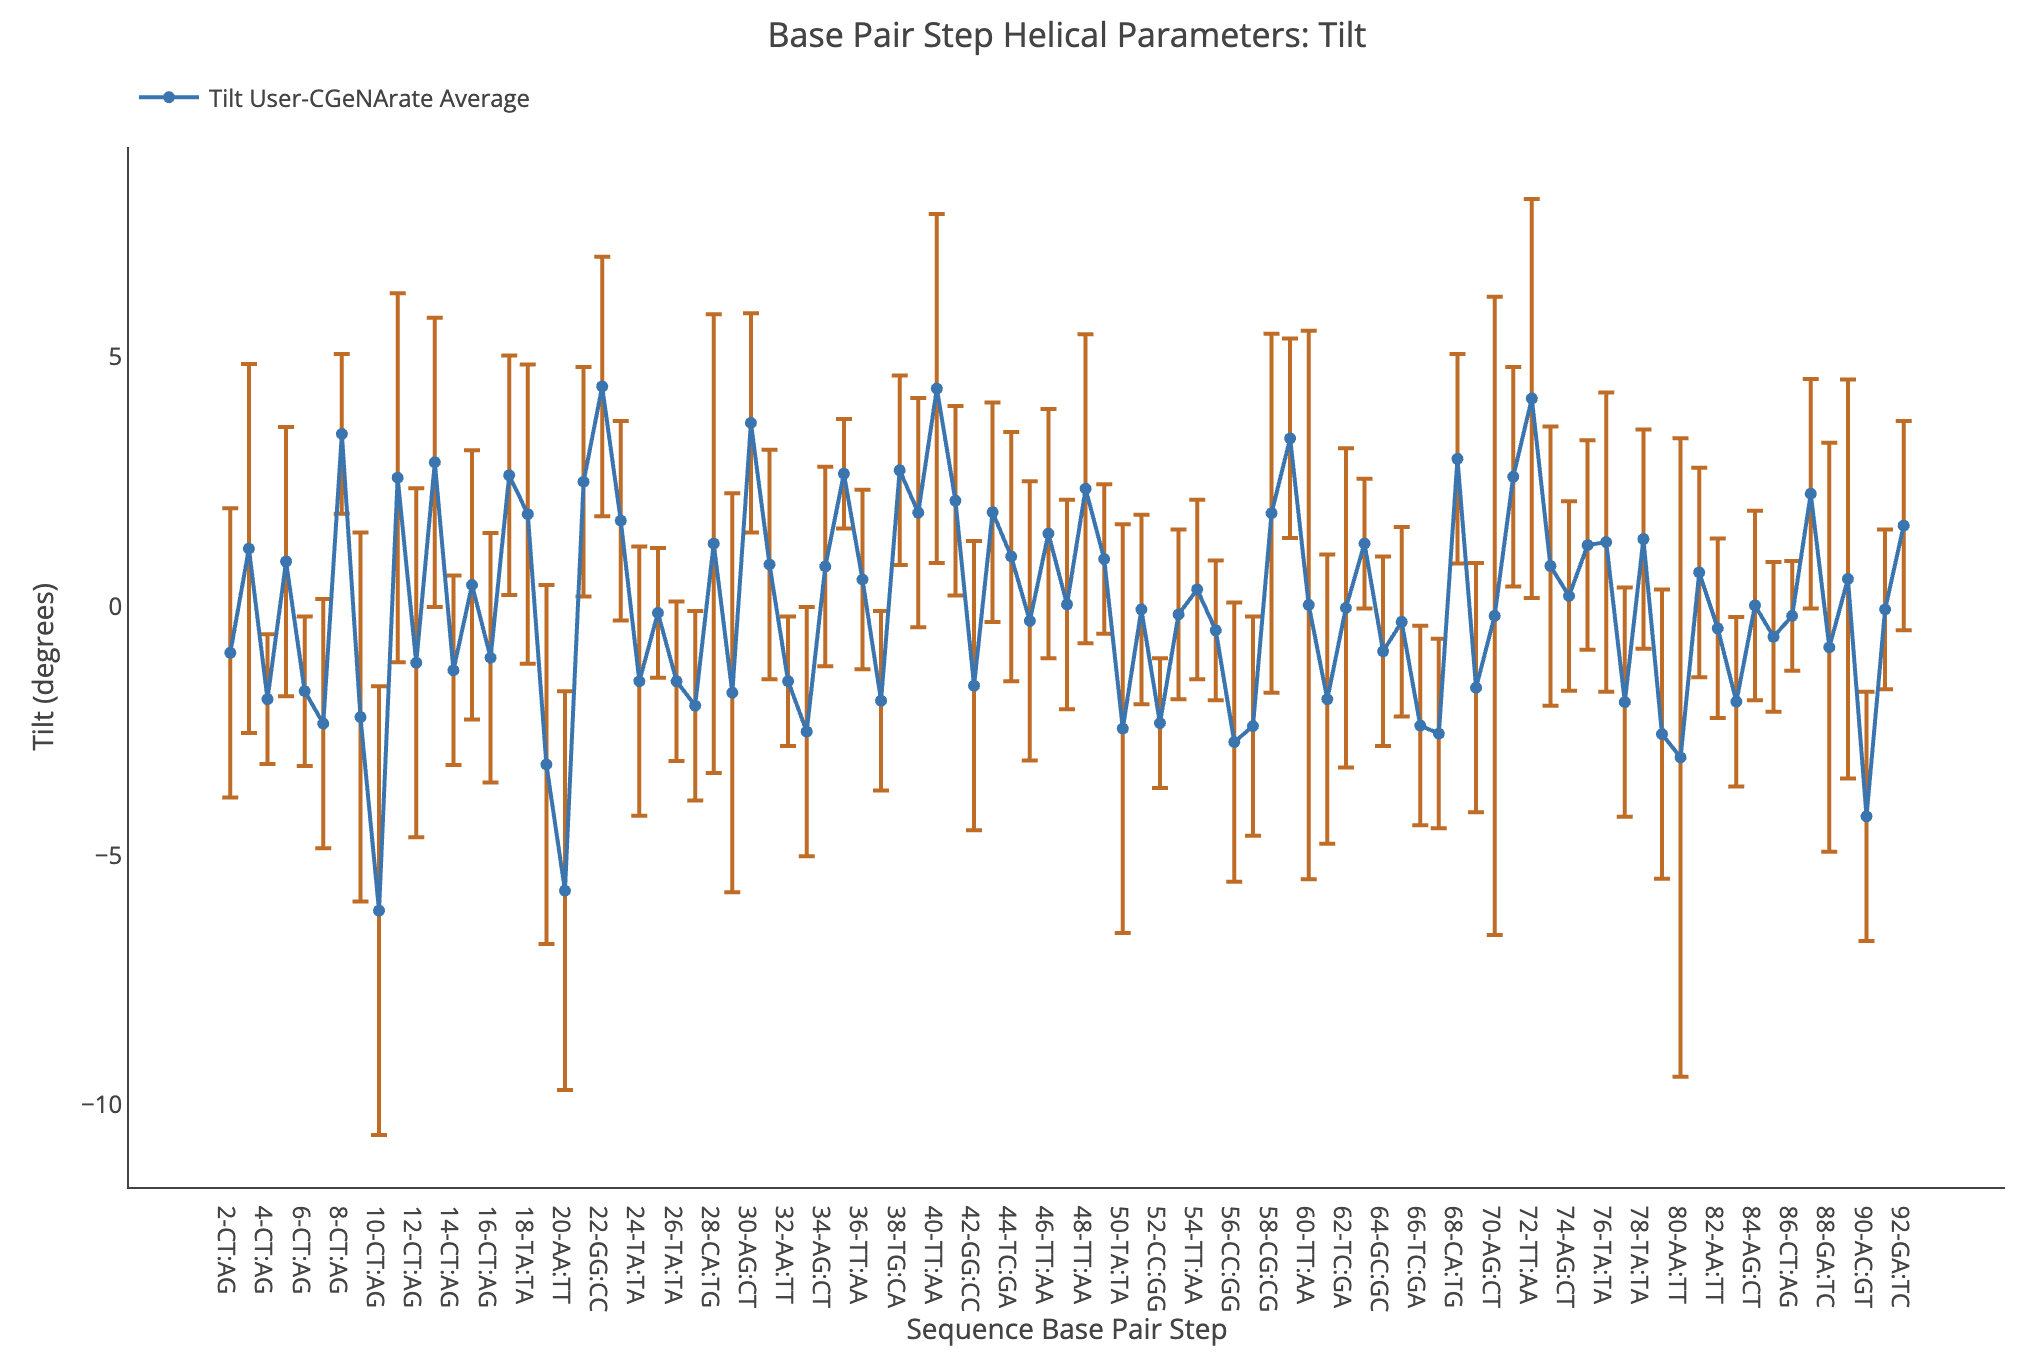
Tilt
Tilt average value, together with its associated standard deviation (for trajectories) is shown for each of the base pair steps in the sequence in a blue point-line. Y-axis: Tilt value in degrees, X-axis: Sequence base pair steps.
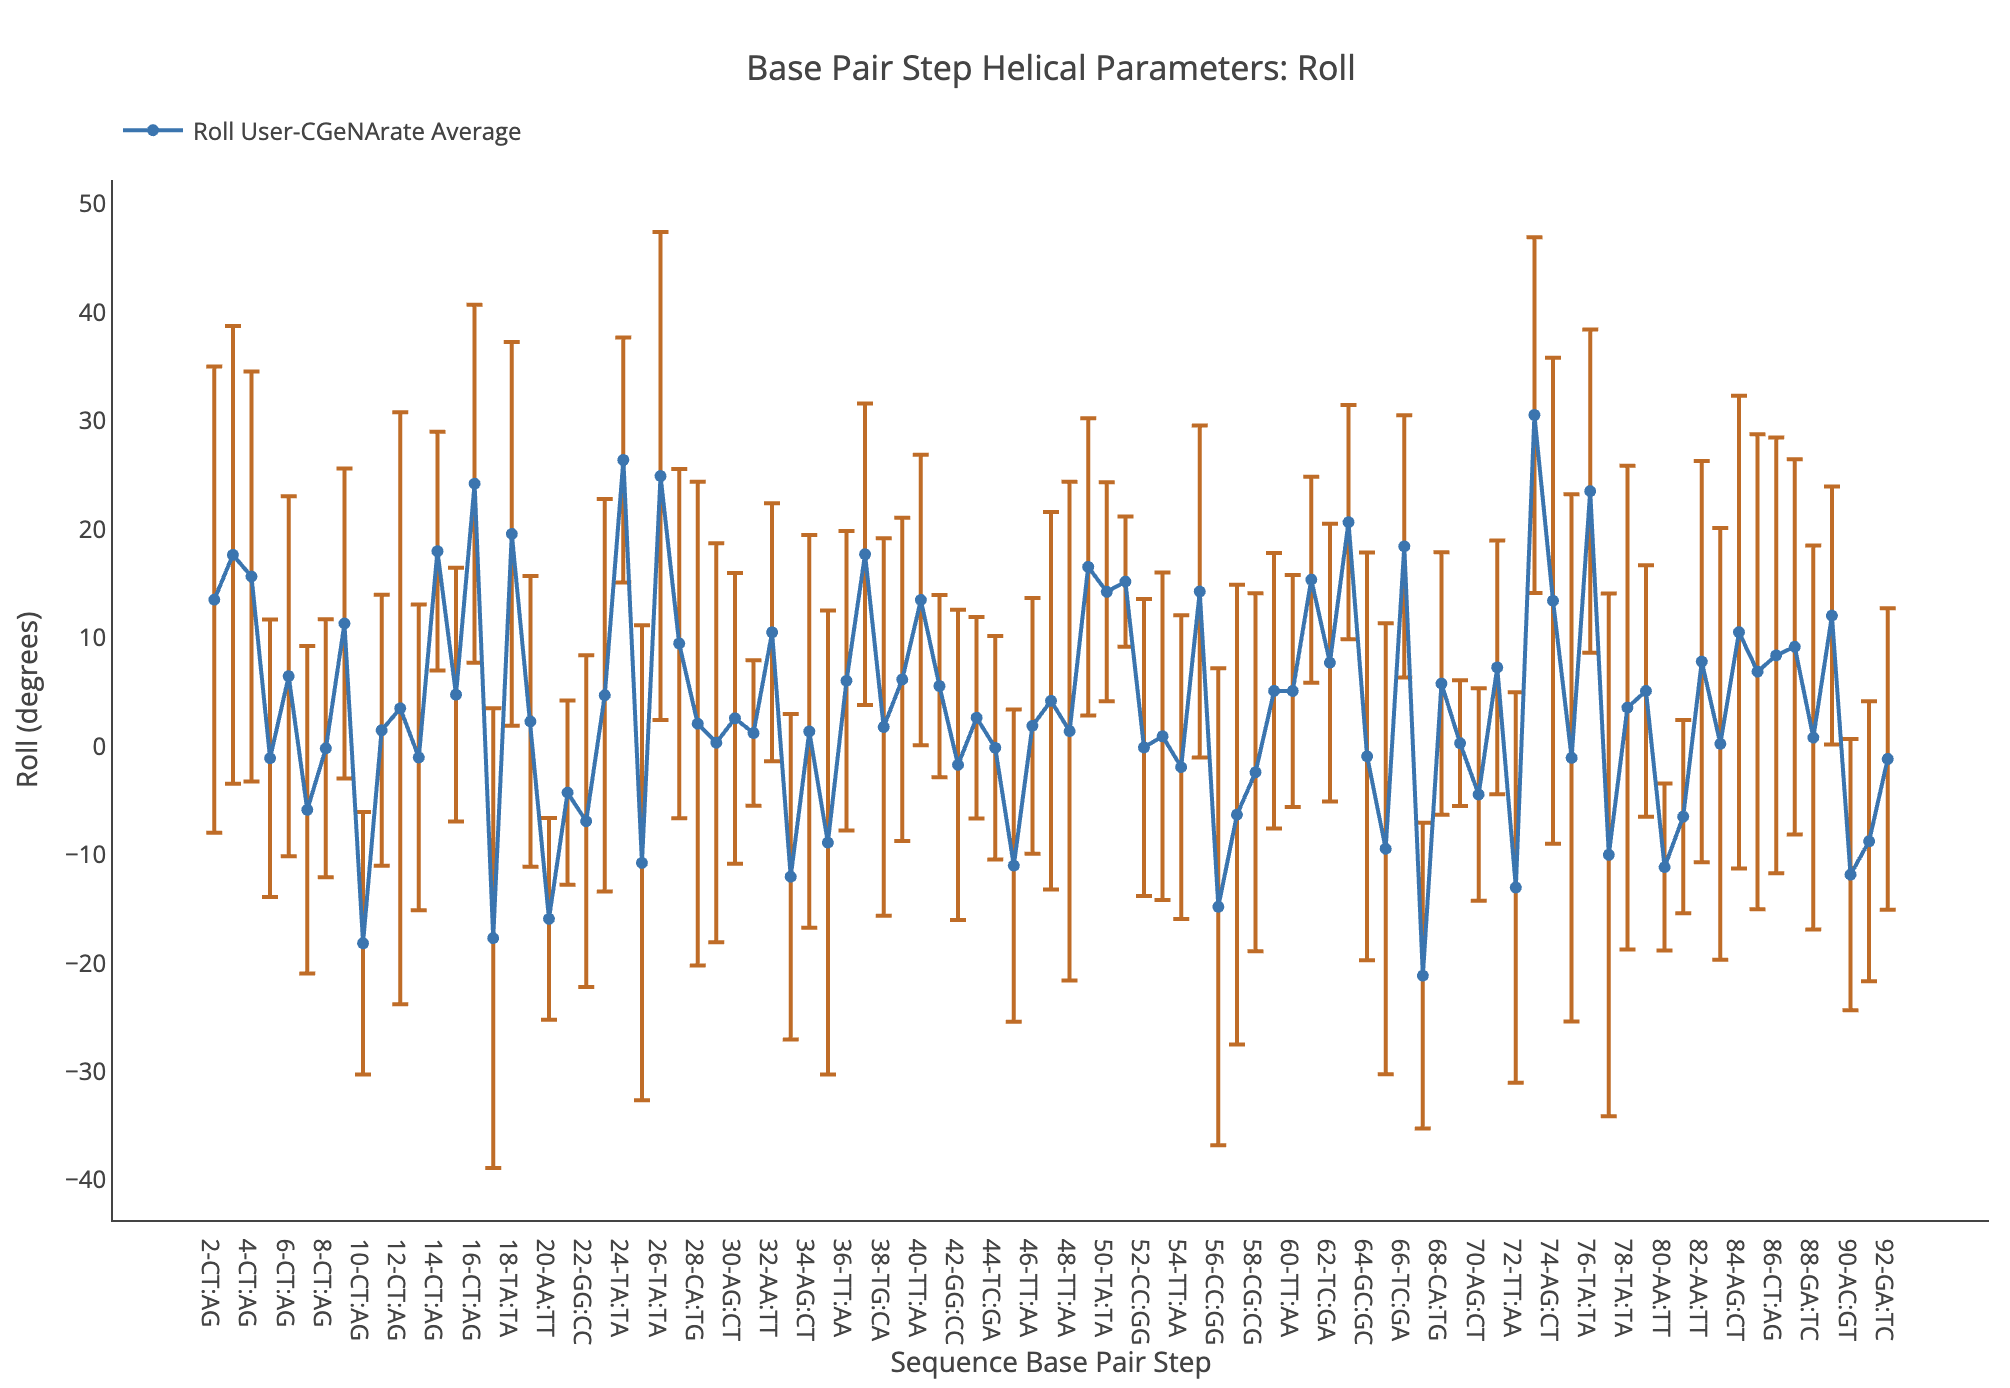
Roll
Roll average value, together with its associated standard deviation (for trajectories) is shown for each of the base pair steps in the sequence in a blue point-line. Y-axis: Roll value in degrees, X-axis: Sequence base pair steps.
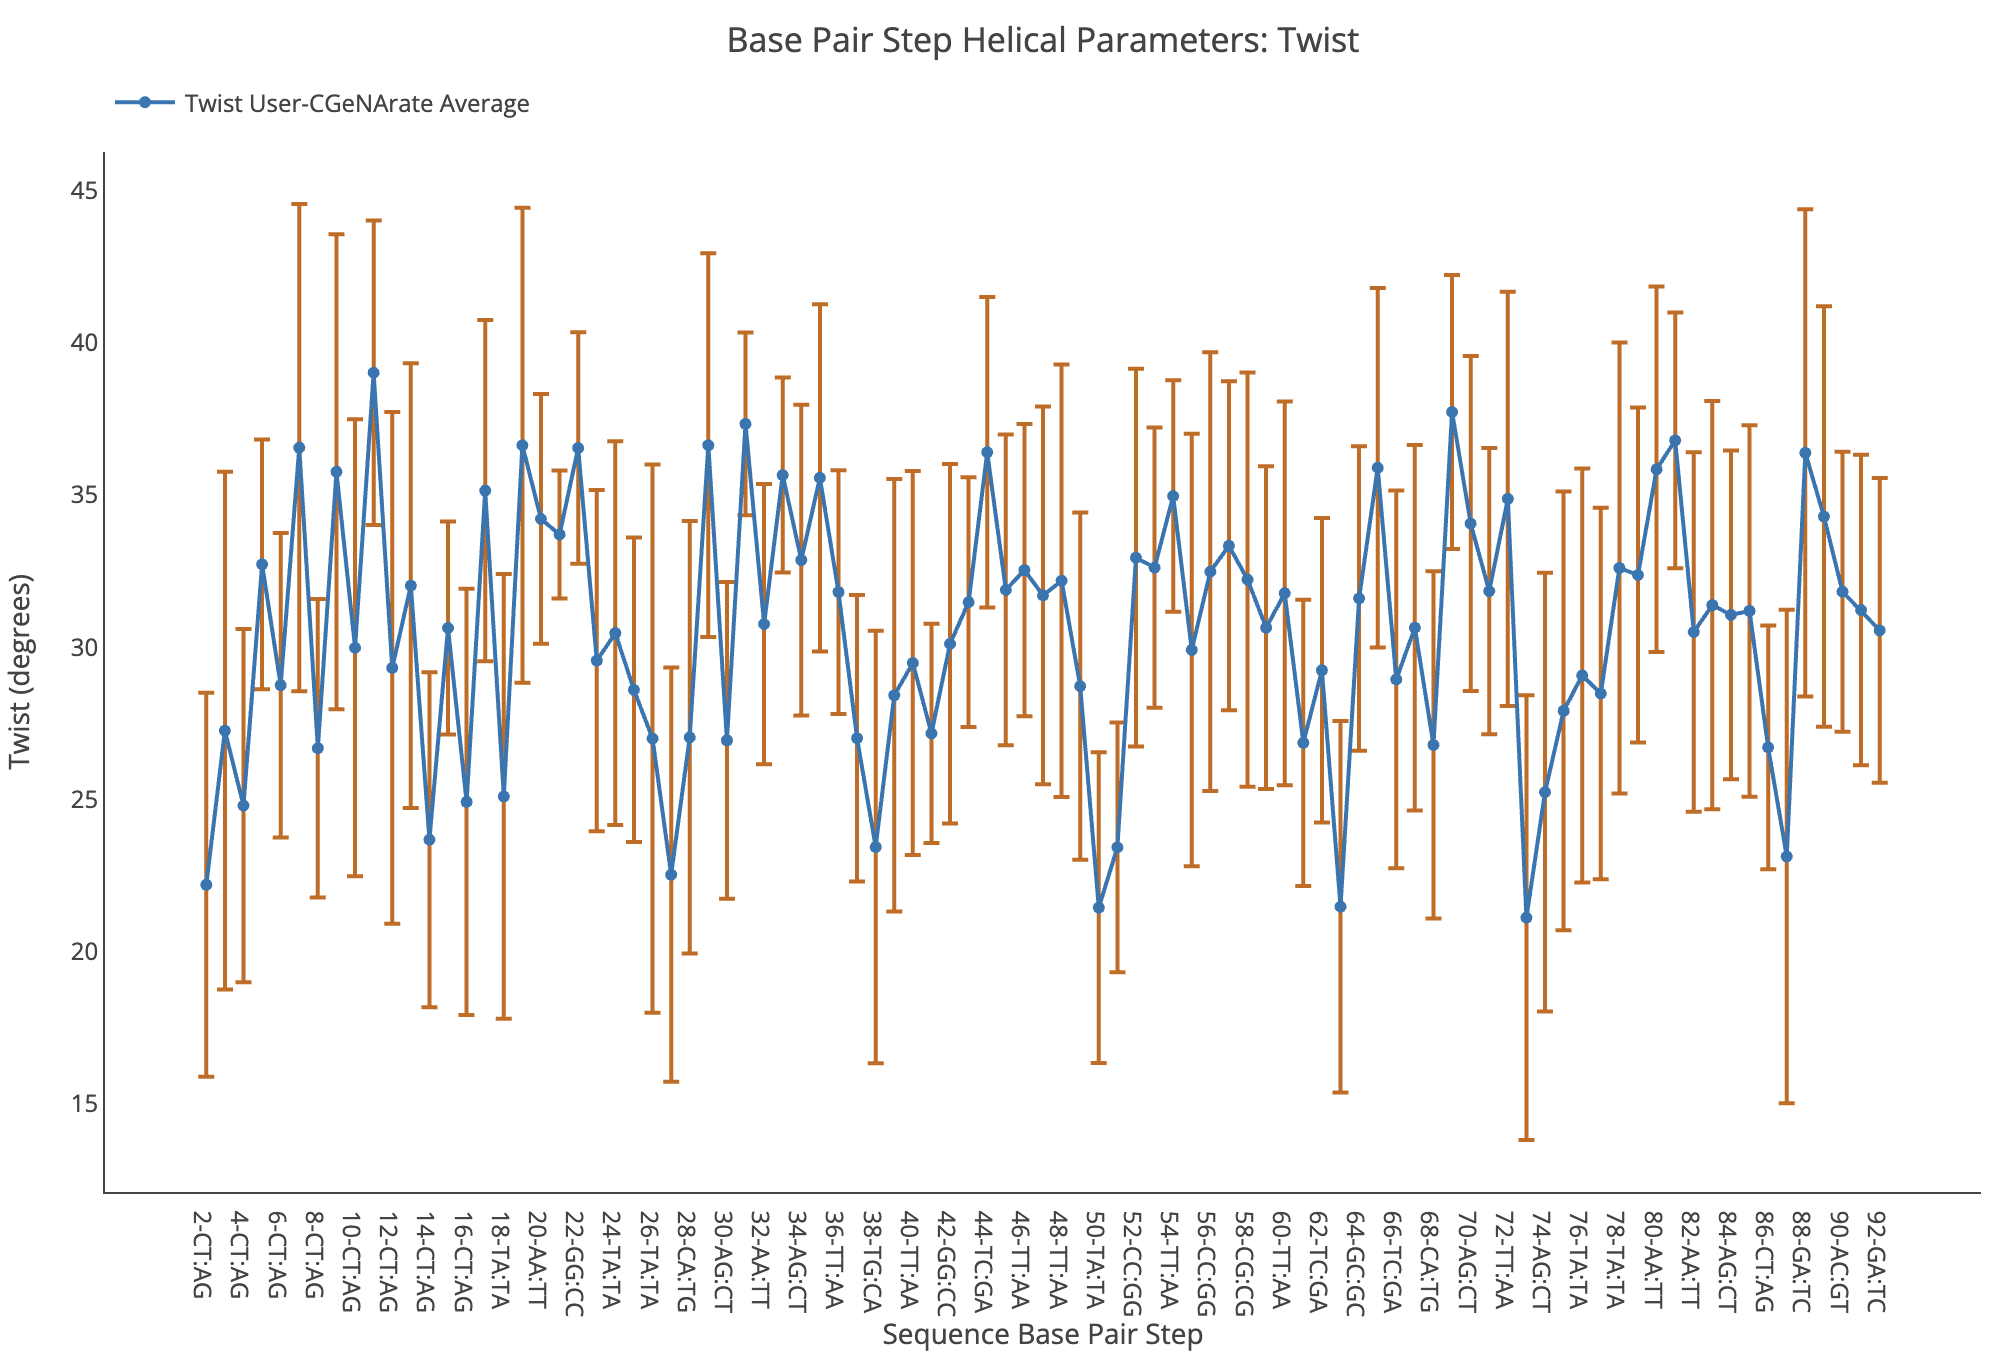
Twist
Twist average value, together with its associated standard deviation (for trajectories) is shown for each of the base pair steps in the sequence in a blue point-line. Y-axis: Twist value in degrees, X-axis: Sequence base pair steps.
Grooves
Method
Nucleic Acid Structure's strand backbones appear closer together on one side of the helix than on the other. This creates a Major groove (where backbones are far apart) and a Minor groove (where backbones are close together). Depth and width of these grooves can be measured giving information about the different conformations that the nucleic acid structure can achieve.
- Major Groove Width.
- Major Groove Depth.
- Minor Groove Width.
- Minor Groove Depth.
Results
Grooves analyses are shown in a set of line plots. The parameter value (average value + standard deviation in the trajectory) is represented with a blue point-line (y-axis) for each of the base pair steps along the input sequence (x-axis).
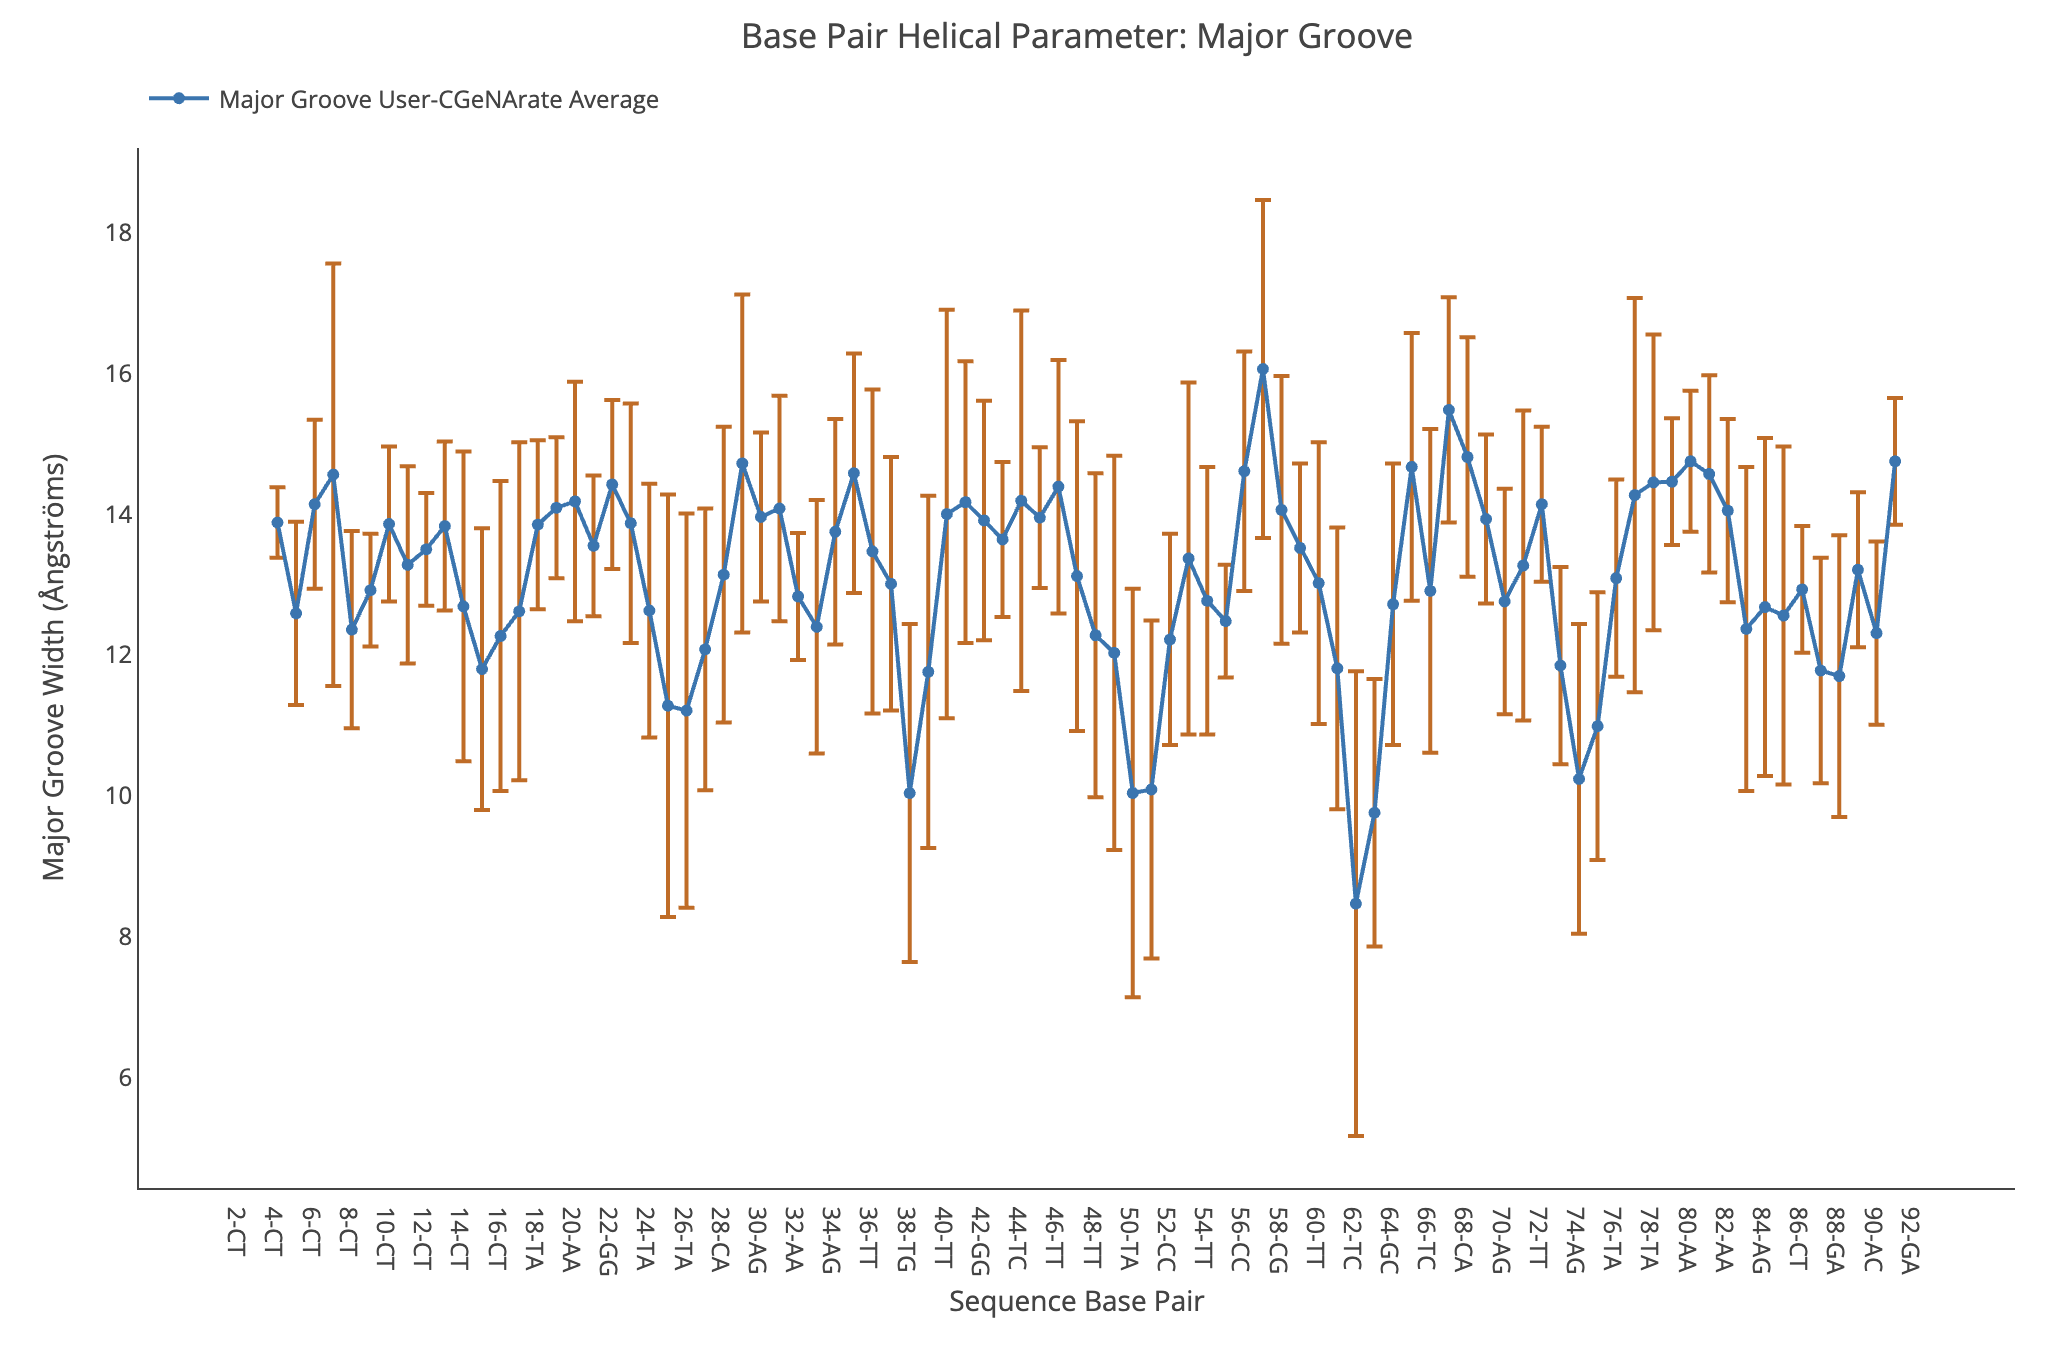
Major Groove Width
Major Groove Width average value, together with its associated standard deviation (for trajectories) is shown for each of the base pair steps in the sequence in a blue point-line. Y-axis: Major Groove Width value in Angstroms, X-axis: Sequence base pair steps.
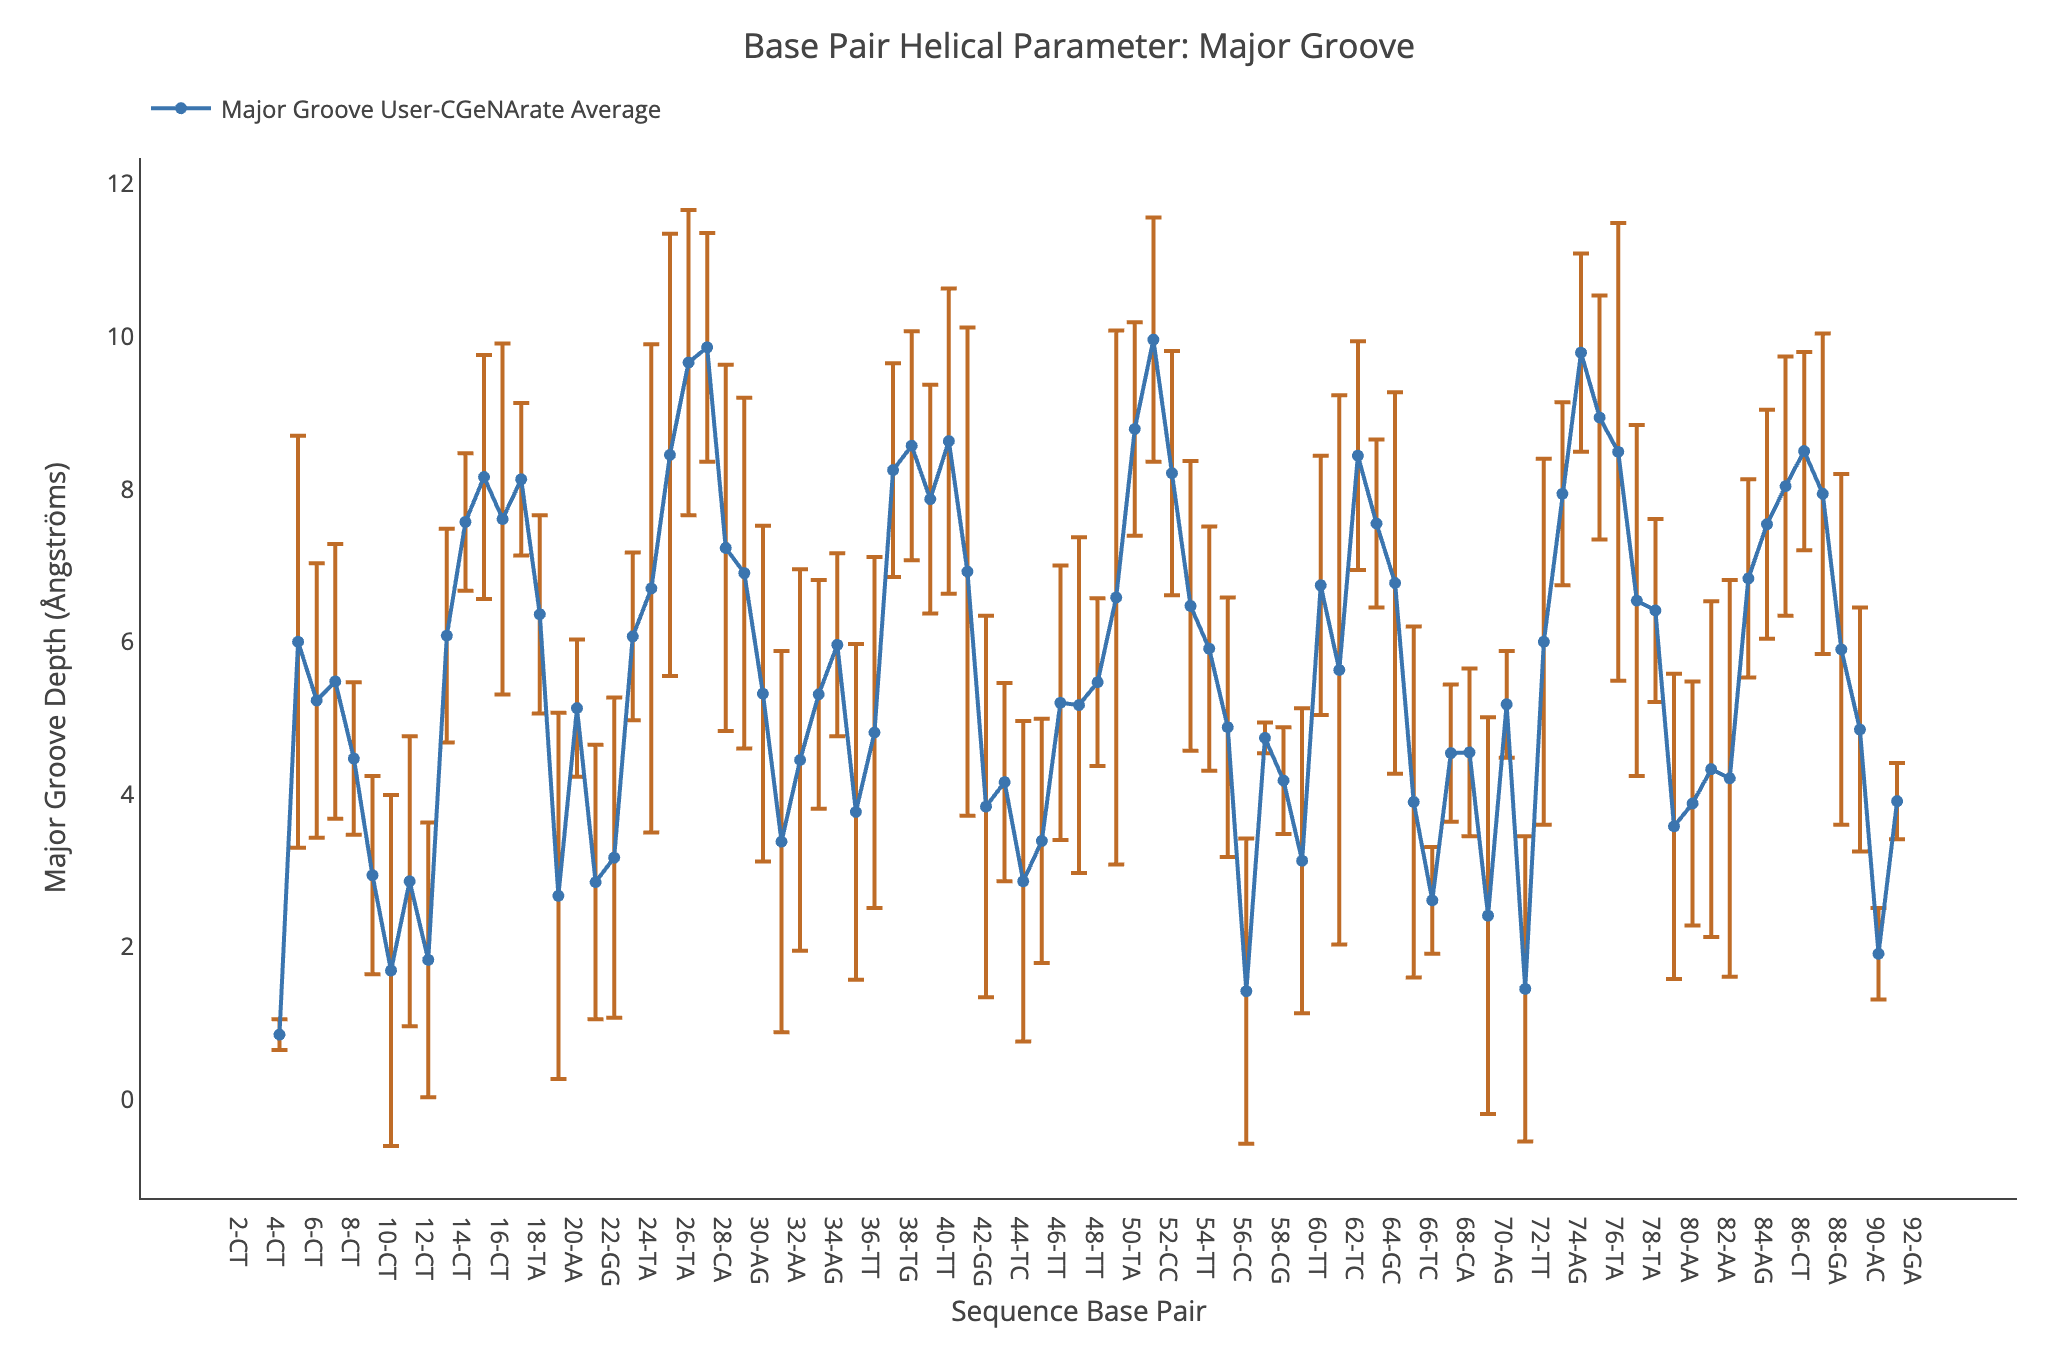
Major Groove Depth
Major Groove Depth average value, together with its associated standard deviation (for trajectories) is shown for each of the base pair steps in the sequence in a blue point-line. Y-axis: Major Groove Depth value in Angstroms, X-axis: Sequence base pair steps.
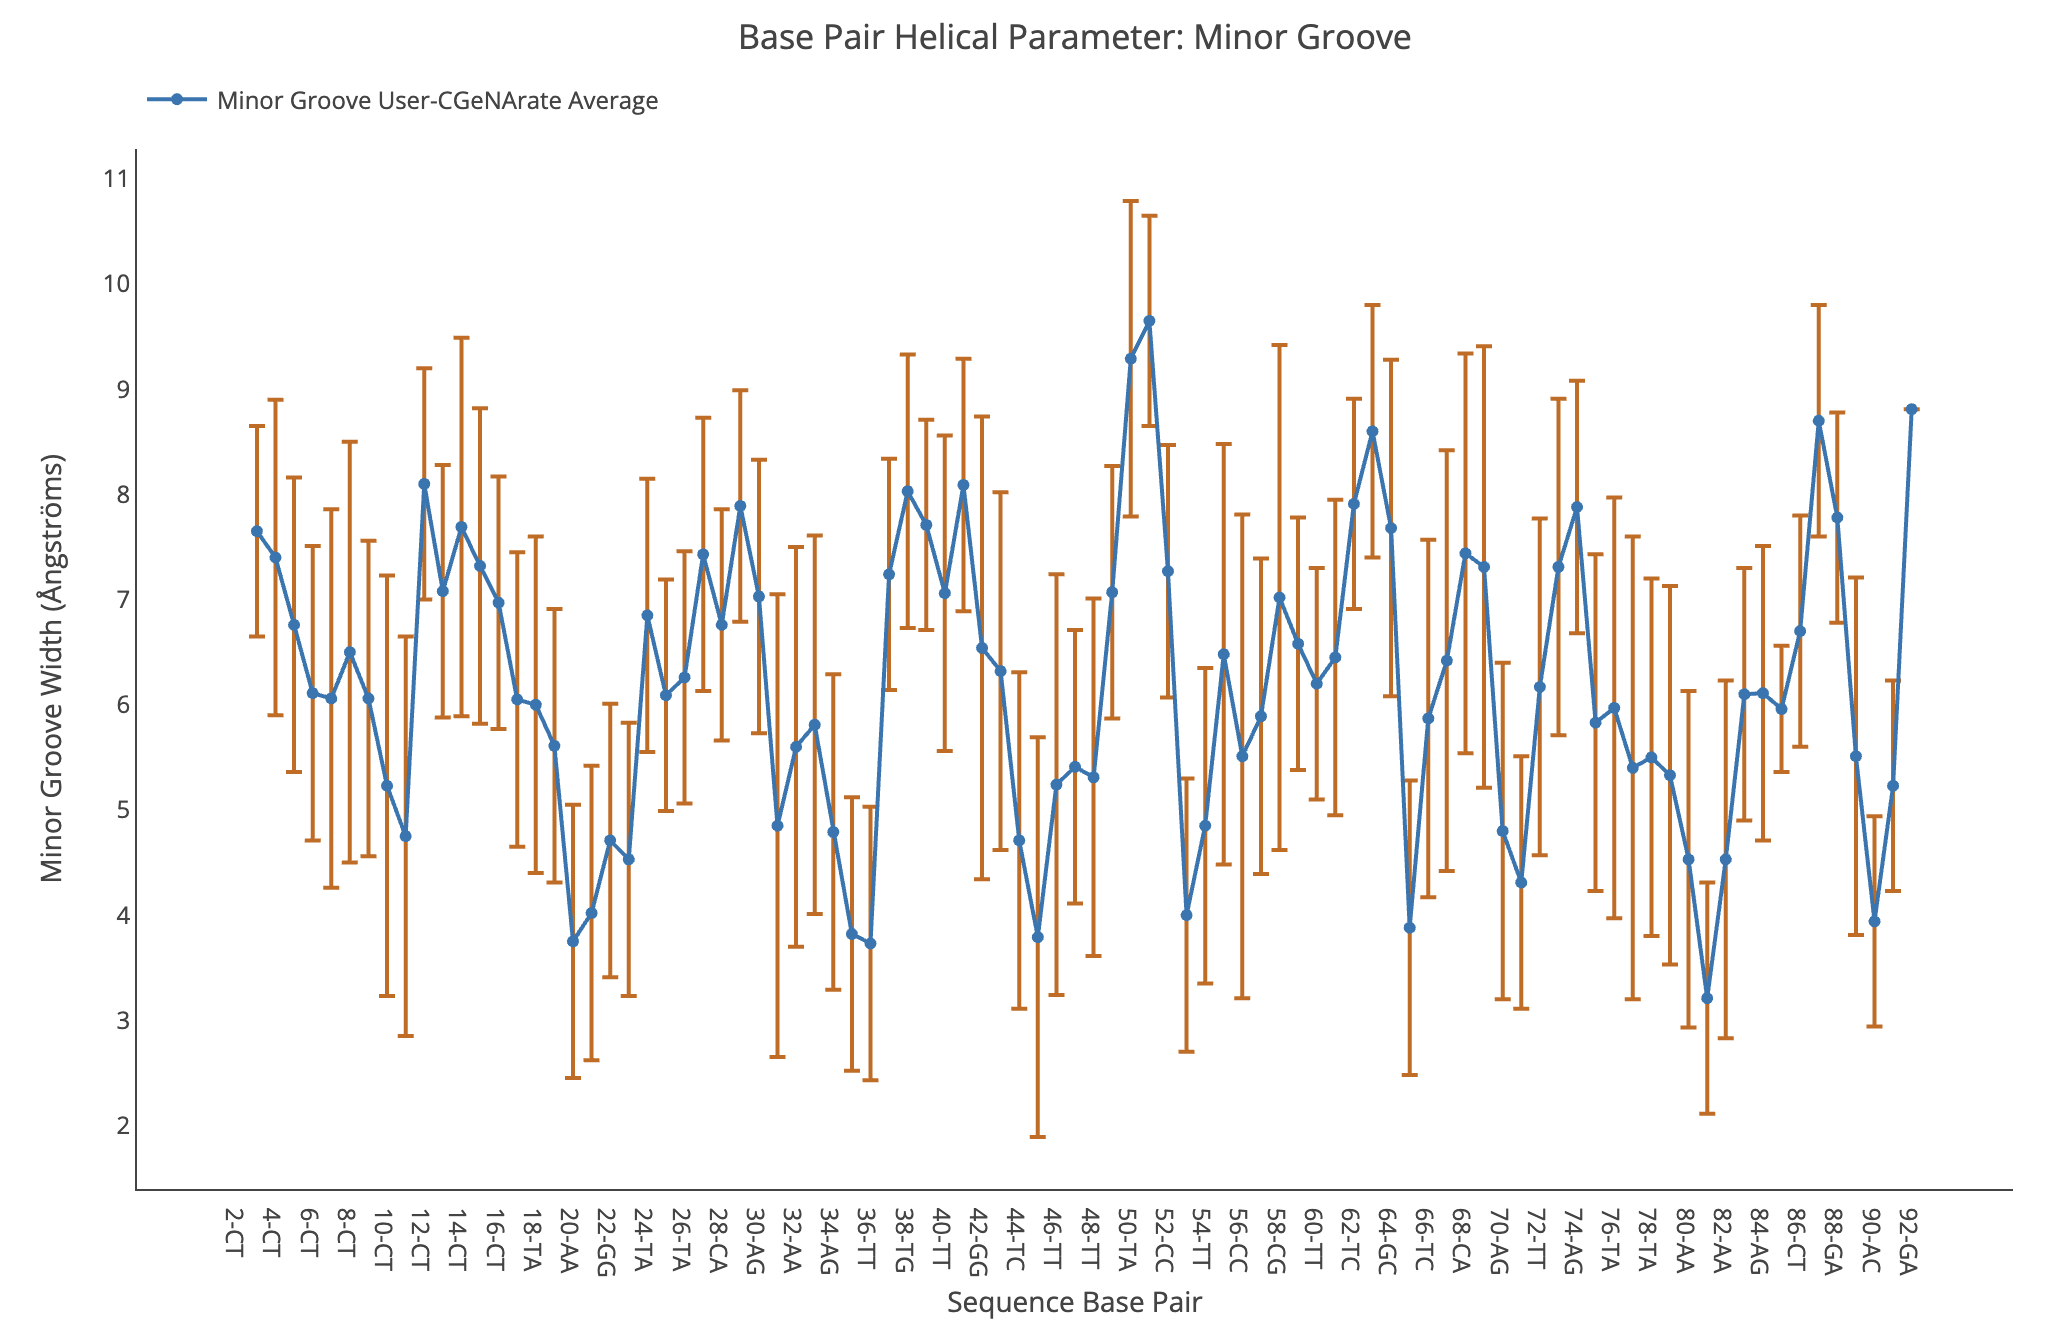
Minor Groove Width
Minor Groove Width average value, together with its associated standard deviation (for trajectories) is shown for each of the base pair steps in the sequence in a blue point-line. Y-axis: Minor Groove Width value in Angstroms, X-axis: Sequence base pair steps.
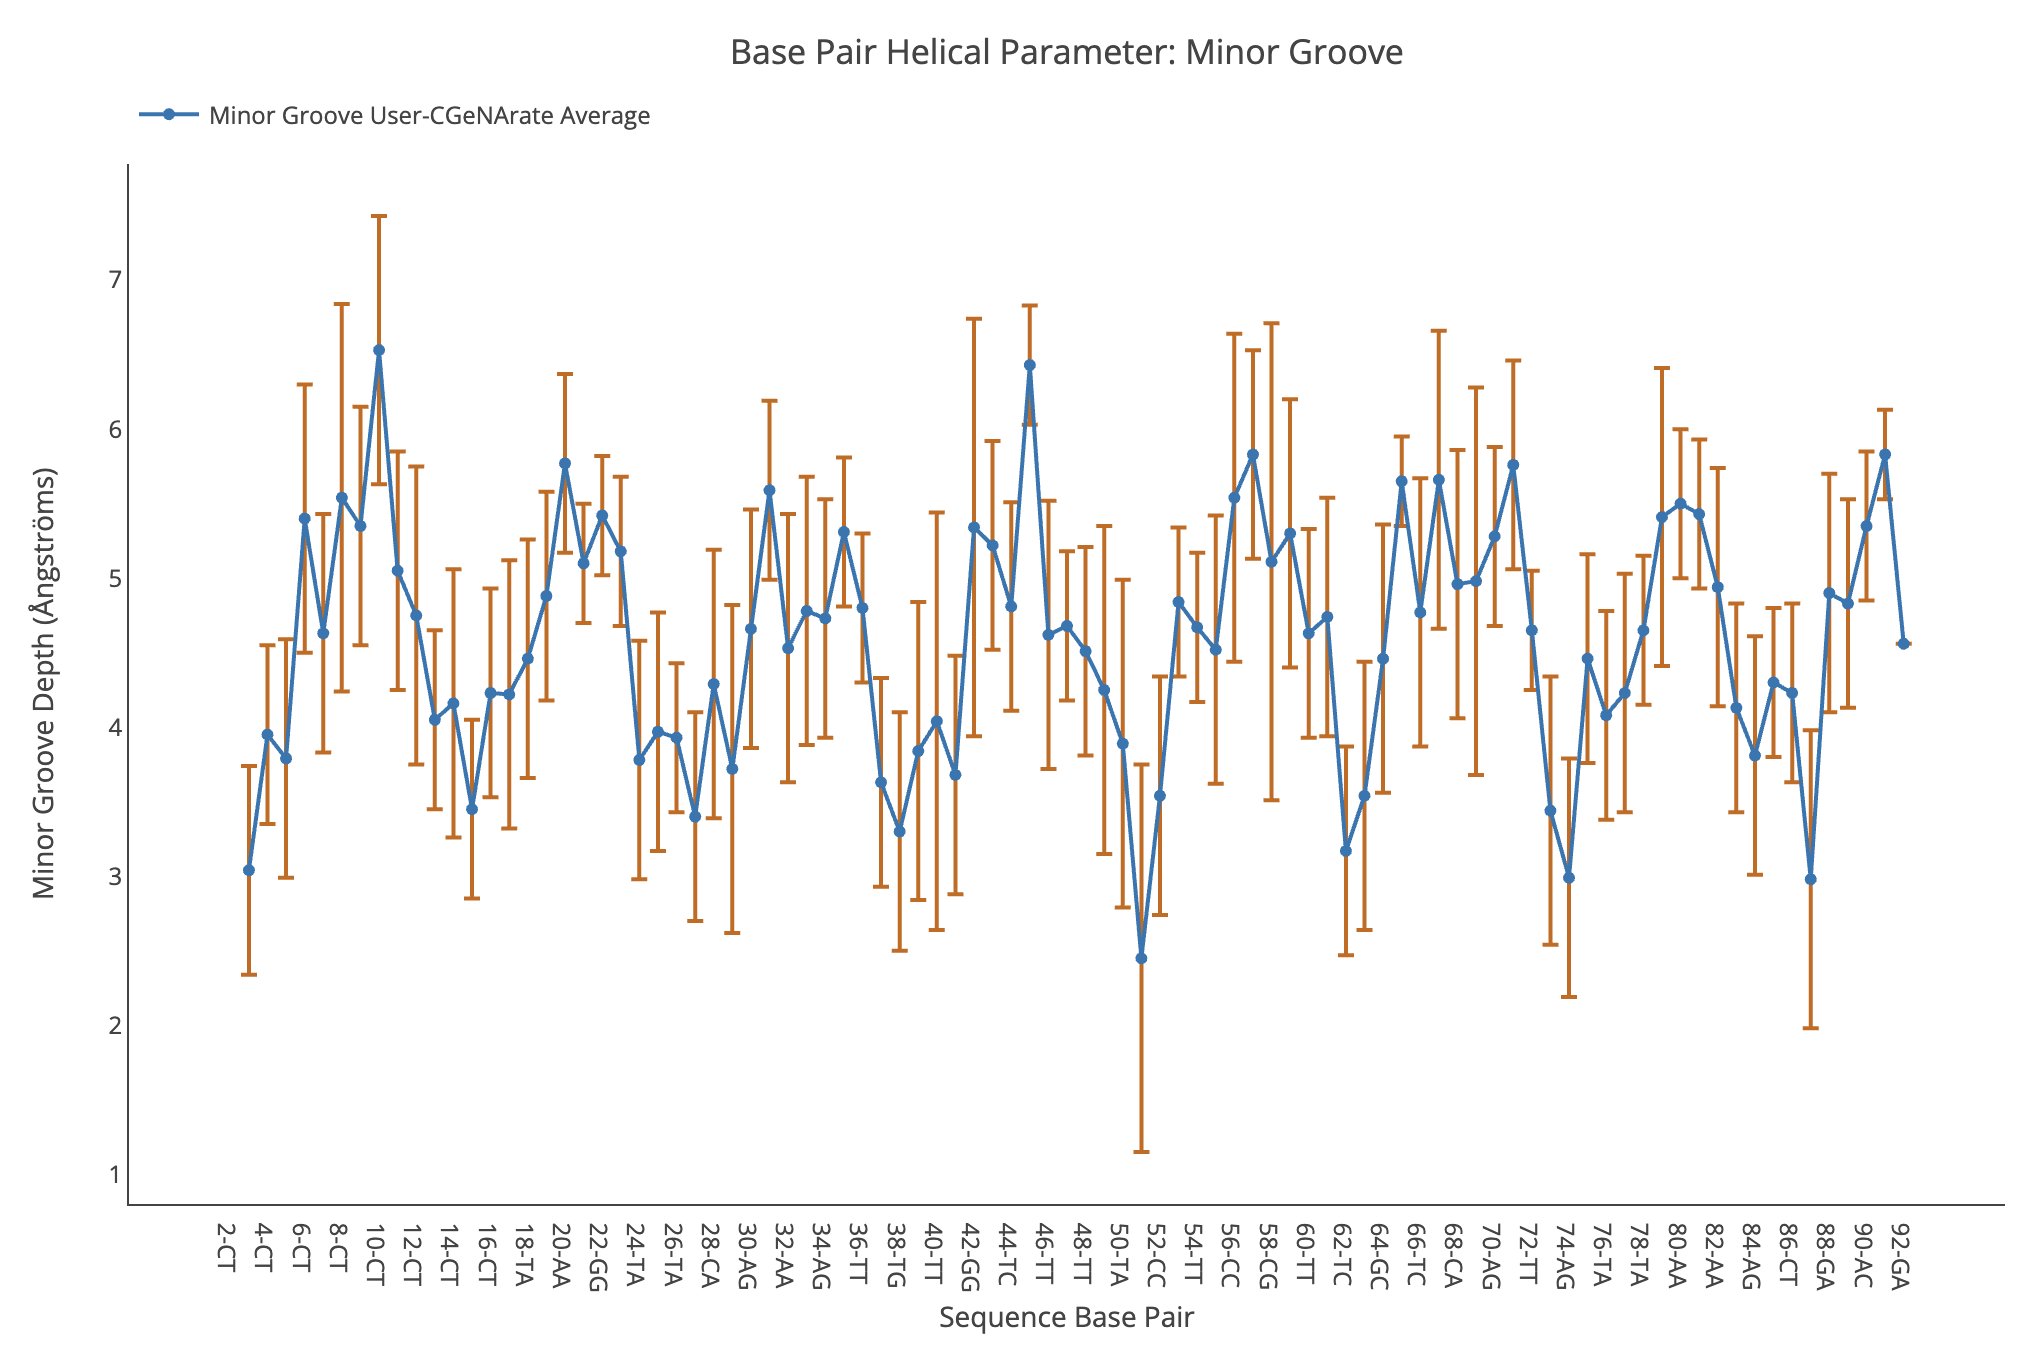
Minor Groove Depth
Minor Groove Depth average value, together with its associated standard deviation (for trajectories) is shown for each of the base pair steps in the sequence in a blue point-line. Y-axis: Minor Groove Depth value in Angstroms, X-axis: Sequence base pair steps.