MC DNA Help - Analysis SASA
Solvent Accessible Surface Area
Method
Solvent Accessible Surface Area (SASA) is computed for the Protein-DNA method of MCDNA. The SASA for the nucleic fiber allows an easy identification of the fragments of DNA affected by the attached proteins, not only in the regions where they are docked, but also in protein-free regions that see their accessibility hindered by these proteins.
SASA plots can be seen as a type of virtual, in-silico DNA footprinting. DNA footprinting is an experimental method to identify sequence specificity of DNA-binding proteins. The gel electrophoresis lanes obtained in the study allow them to identify and determine the DNA sequence fragment from the protected area that is called the footprint, the area where the protein binds to the DNA. SASA also decreases abruptly in the DNA fragments where a protein is attached, creating a similar effect in the plots (see results).

Adapted from Fig 5.37 – DNAse footprinting.
Molecular Biology, Robert F. Weaver, University of Kansas-Lawrence.
Chapter 5: Molecular Tools for Studying Genes and Gene Activity.
Solvent Accessible Surface Area is designated as the region of the molecule surface exposed enough to be able to interact with solvent molecules. It is usually defined as a surface built by the delineation drawn by the center of a sphere (rough representation of a solvent molecule, usually of 1.4 Å of radii; i.e. a water molecule) rolling over the molecular surface (see figure below).
SASA values are computed in this analysis using the well-known software called NACCESS (S. Hubbard and J. Thornton, "'NACCESS' computer program," Department of Biochemistry and Molecular Biology, University College London, 1993.), developed by Simon Hubbard in Manchester.
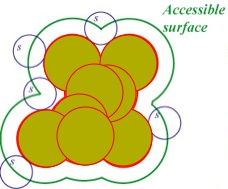
Solvent Accessible Surface Area (SASA). Atoms of the protein are represented as van der Waals spheres, and the solvent accessible surface area is defined by the center of a rolling ball (S) representing the solvent molecule while going over the protein surface.
Reference averaged-values for the different DNA bases (A, C, T, G) were computed in a naked fiber, right handed B-DNA (Arnott) modeled using NAFlex web server (http://mmb.irbbarcelona.org/NAFlex). These values are plotted together with the user-generated structure/trajectory SASA for the sake of comparison (see results).
Results
Results for the SASA analysis are divided in two main sections:
- 3D view
- SASA plot
The 3D view shows an NGL interactive representation of the structure or trajectory with the DNA fiber together with the attached proteins, properly labeled with their PDB code. In the case of a trajectory, a slider is provided to go through the whole snapshots ensemble. Every time a different snapshot is selected, the corresponding structure is represented in the viewer, and its associated SASA plot is drawn in the SASA section below.
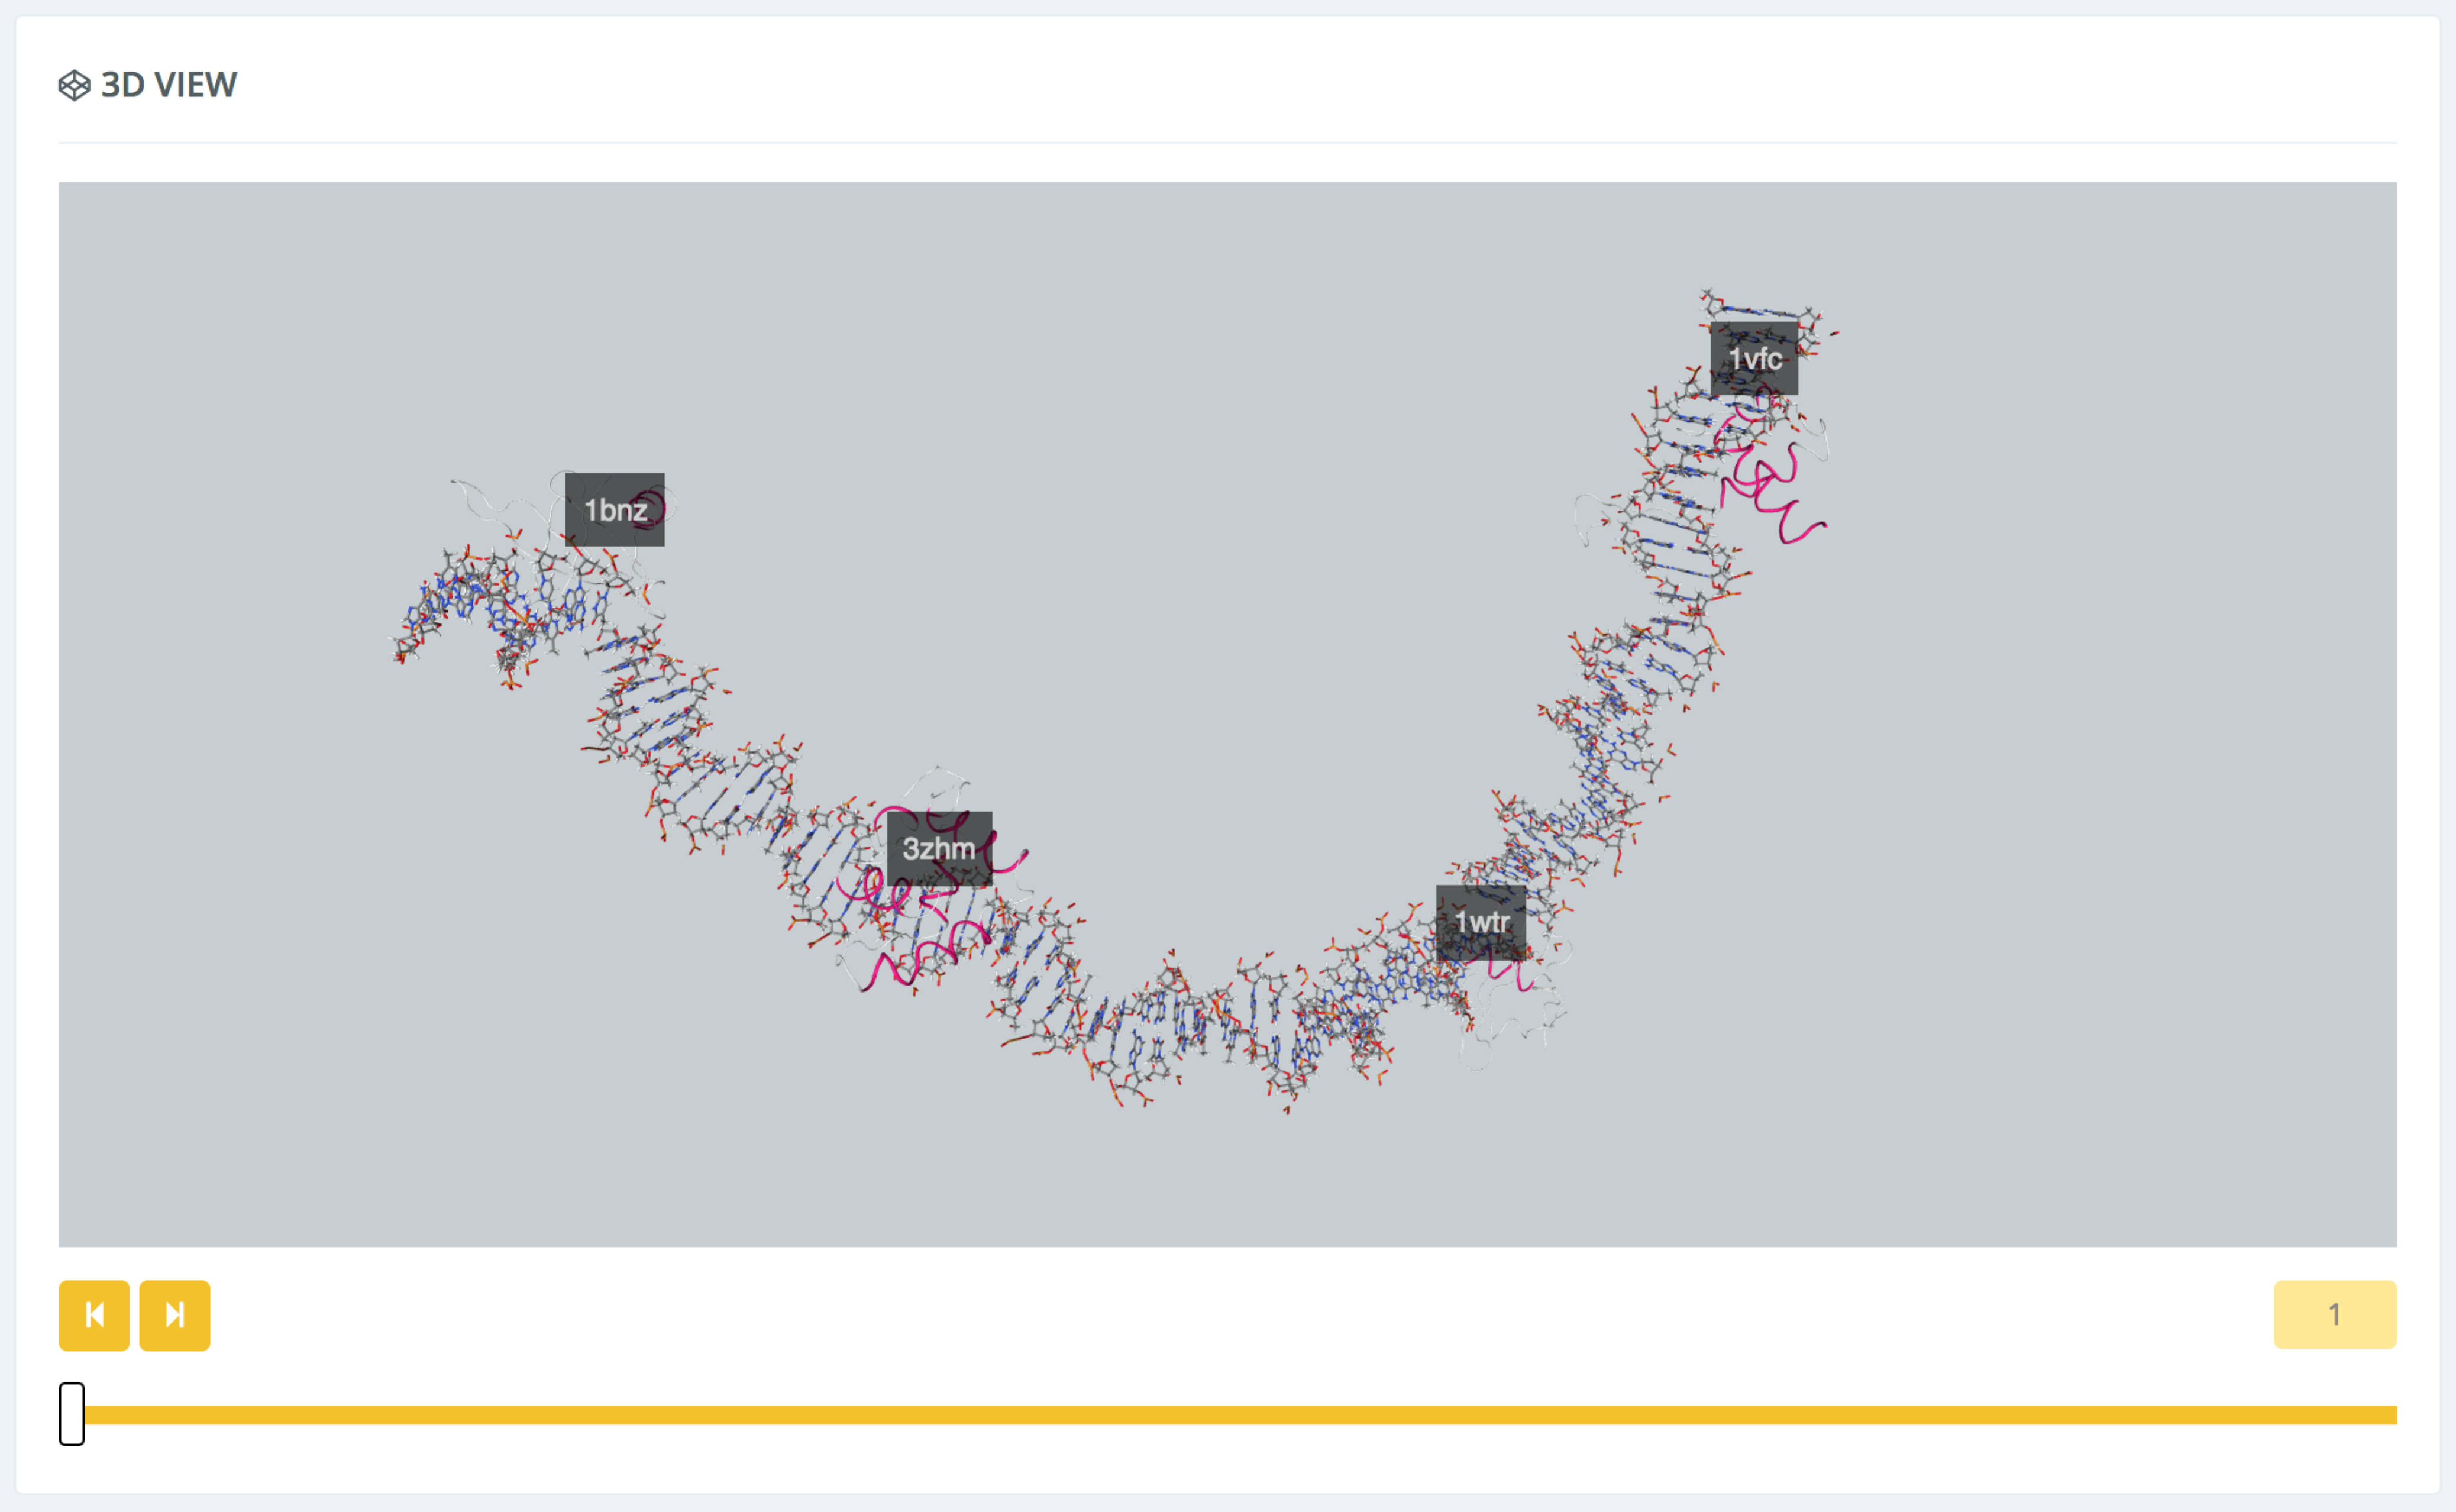
Note that the 3D representation and the plot are interconnected: when the mouse is passing over the SASA plot, the corresponding nucleotide base of the DNA in the NGL viewer is highlighted (using a VdW representation), in order to easily identify the structure region being analyzed.

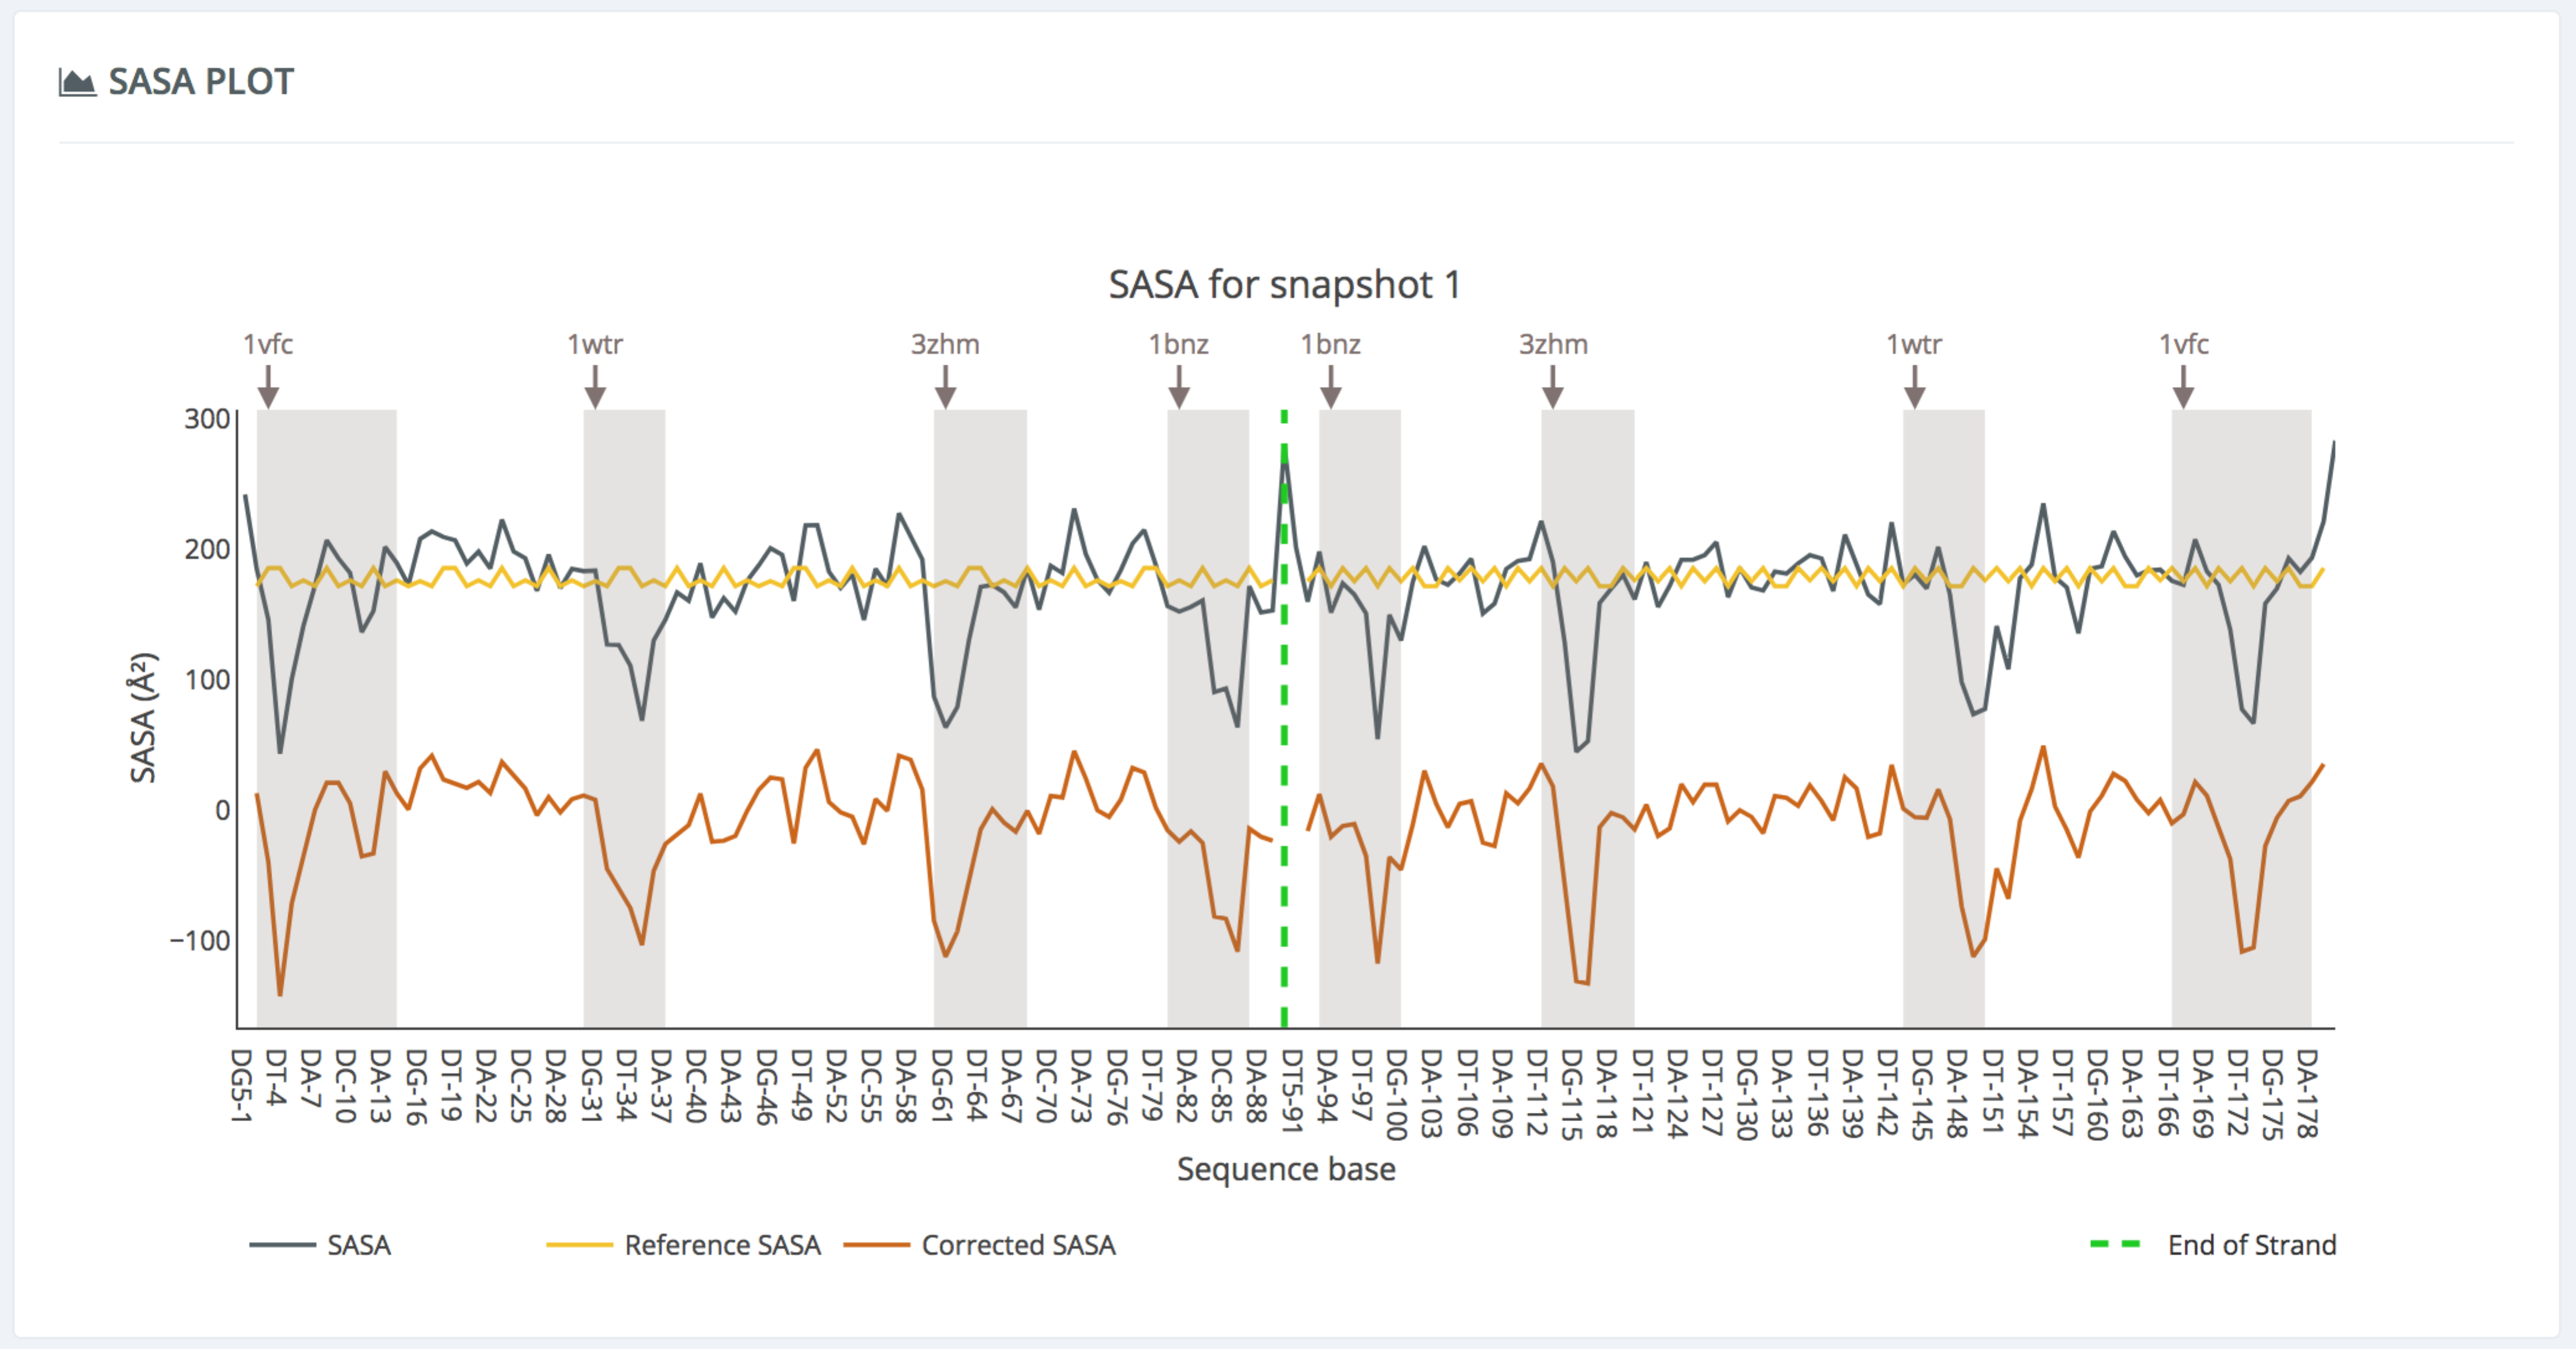
The SASA plot section then represents the solvent accessible surface area computed for the particular selected structure. Three line values are depicted: the user-generated DNA fiber SASA (green), the reference SASA (yellow), and the corrected SASA (DNA fiber SASA – reference SASA, orange). The DNA fragments where proteins are placed are highlighted with grey-shaded regions, accompanied by the corresponding protein PDB code. The footprinting areas should fall into the grey-shaded regions, where the DNA is protected by the proteins.