MC DNA Help - Analysis Stiffness
Stiffness
Method
Elastic force constants associated with helical deformation at the base pair step level were determined by inversion of the covariance matrix in helical space, which yields stiffness matrices whose diagonal elements provide the stiffness constants associated with pure rotational (twist, roll and tilt) and translational (rise, shift and slide) deformations within the given step.
$$ \Xi_h = k_BTC_h^{-1} = \left[\begin{matrix} k_{twist} & k_{t - r} & k_{t - l} & k_{t - i} & k_{t - s} & k_{t - d} \\ k_{t - r} & k_{roll} & k_{r - l} & k_{r - i} & k_{r - s} & k_{r - d} \\ k_{t - l} & k_{r - l} & k_{tilt} & k_{l - i} & k_{l - s} & k_{l - d} \\ k_{t - i} & k_{r - i} & k_{l - i} & k_{rise} & k_{i - s} & k_{i - d} \\ k_{t - s} & k_{r - s} & k_{l - s} & k_{i - s} & k_{shift} & k_{s - d} \\ k_{t - d} & k_{r - d} & k_{l - d} & k_{i - d} & k_{s - d} & k_{slide} \\ \end{matrix}\right] $$
Results
Stiffness analyses are shown in a set of line plots. The parameter value (or average value + standard deviation in case of structure ensemble) is represented with a yellow point-line (y-axis) for each of the base pair steps along the input sequence (x-axis).
Shift
Shift stiffness value (for structure) or average value together with its associated standard deviation (for ensembles) is shown for each of the base pair steps in the sequence in a yellow point-line. Y-axis: Shift stiffness value in Kcal/mol * Angstroms2, X-axis: Sequence base pair steps.

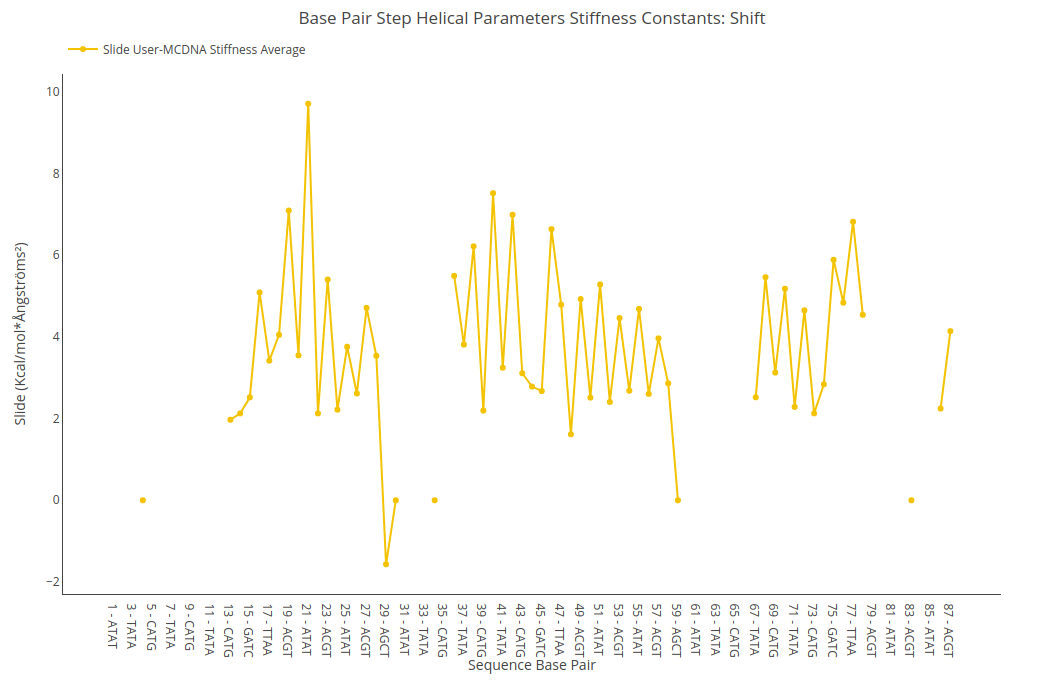
Slide
Slide stiffness value (for structure) or average value together with its associated standard deviation (for ensembles) is shown for each of the base pair steps in the sequence in a yellow point-line. Y-axis: Slide stiffness value in Kcal/mol * Angstroms2, X-axis: Sequence base pair steps.
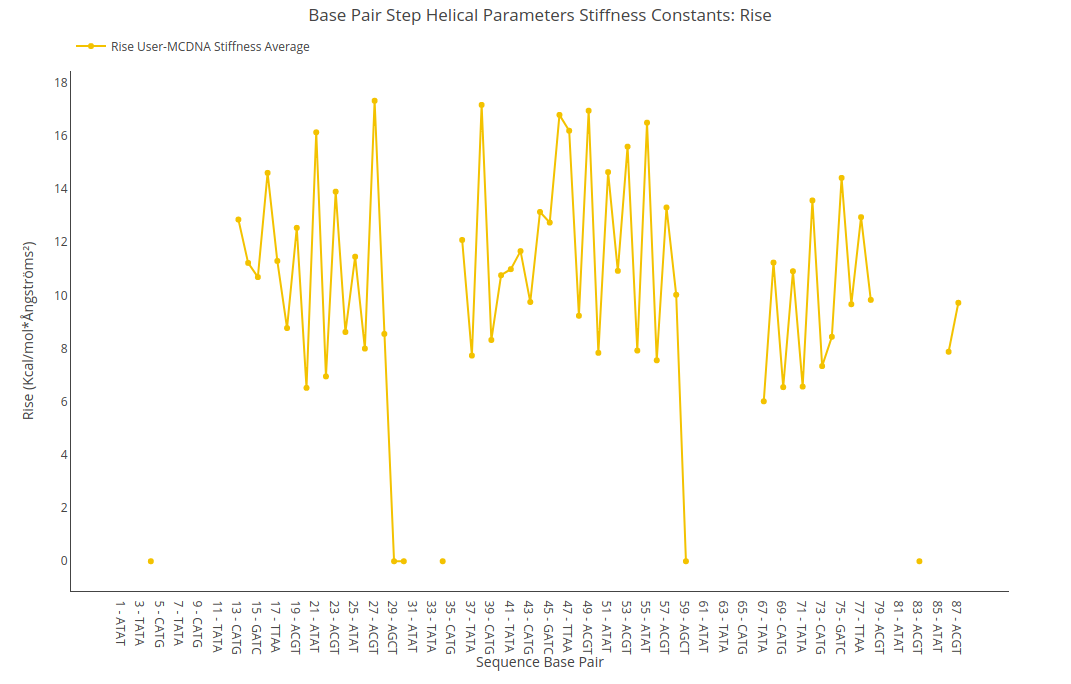
Rise
Rise stiffness value (for structure) or average value together with its associated standard deviation (for ensembles) is shown for each of the base pair steps in the sequence in a yellow point-line. Y-axis: Rise stiffness value in Kcal/mol * Angstroms2, X-axis: Sequence base pair steps.
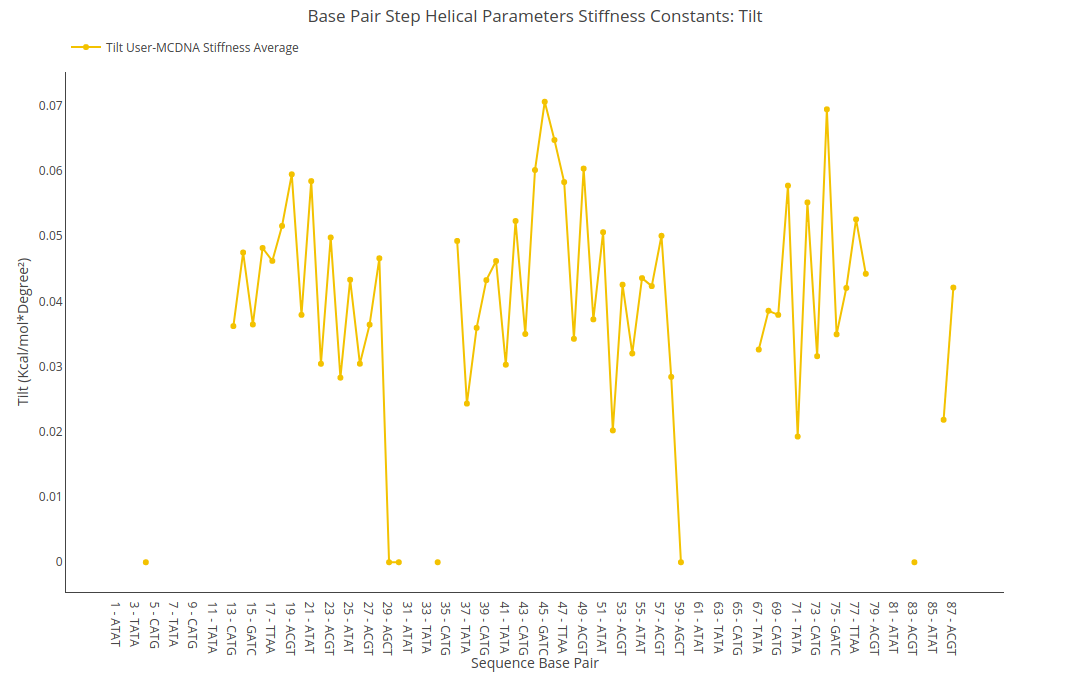
Tilt
Tilt stiffness value (for structure) or average value together with its associated standard deviation (for ensembles) is shown for each of the base pair steps in the sequence in a yellow point-line. Y-axis: Tilt stiffness value in Kcal/mol * degrees2, X-axis: Sequence base pair steps.
Roll
Roll stiffness value (for structure) or average value together with its associated standard deviation (for ensembles) is shown for each of the base pair steps in the sequence in a yellow point-line. Y-axis: Roll stiffness value in Kcal/mol * degrees2, X-axis: Sequence base pair steps.

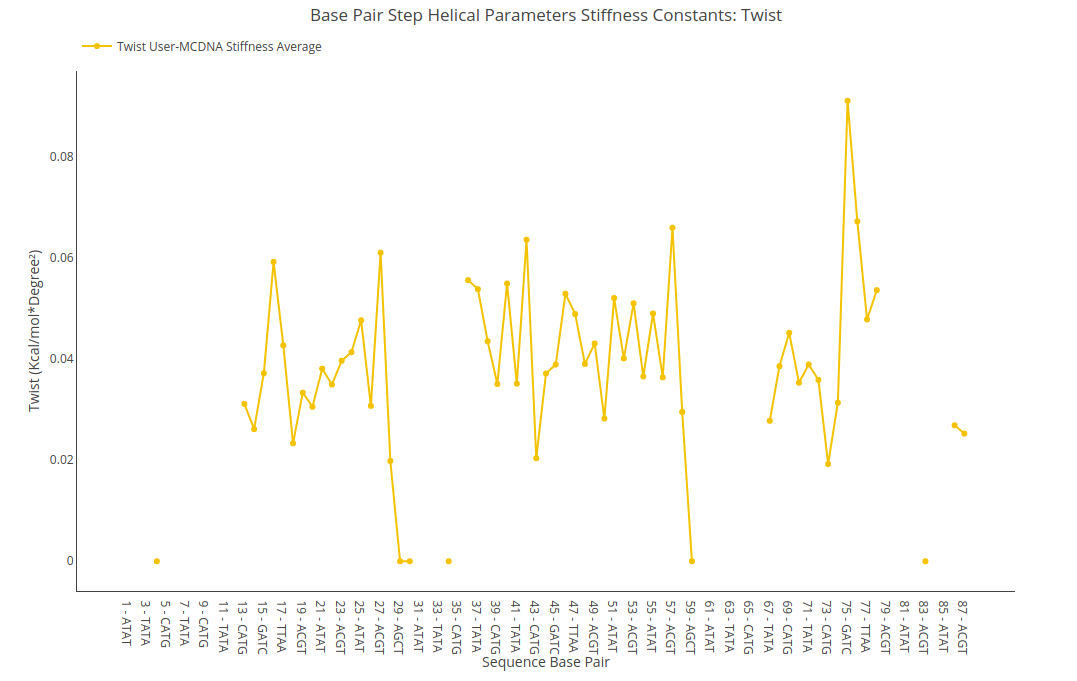
Twist
Twist stiffness value (for structure) or average value together with its associated standard deviation (for ensembles) is shown for each of the base pair steps in the sequence in a yellow point-line. Y-axis: Twist stiffness value in Kcal/mol * degrees2, X-axis: Sequence base pair steps.