
BIGNASim database structure and analysis portal for nucleic acids simulation data
----
DNA & RNA Structure and Helical Parameters Analyses (NAFlex)
----Tutorial 2 -- Global analysis (XCGY)
Tutorial 3 -- Meta-trajectory (XCGY)
Tutorial 4 -- Experimental vs MD analysis
----Analyses
Global Analyses screen is designed to offer a very easy and intuitive way to access to base, base-pair and base-pair step analysis, either for the global set of trajectories stored in the database or for just a selection of interest (from the browse page).
Bullets with different colors represent: bases (red), base-pairs (green) and base-pair steps (blue) in one-letter code, defined below:
- A: Adenine
- C: Cytosine
- G: Guanine
- T: Thymine
- U: Uracil
- R: Purine (Adenine and Guanine)
- Y: Pyrimidine (Cytosine, Thymine, Uracil)
- N: All the previous
Each bullet show together with the base/base-pair/base-pair step code the number of appearances of it in the selected set of sequences.
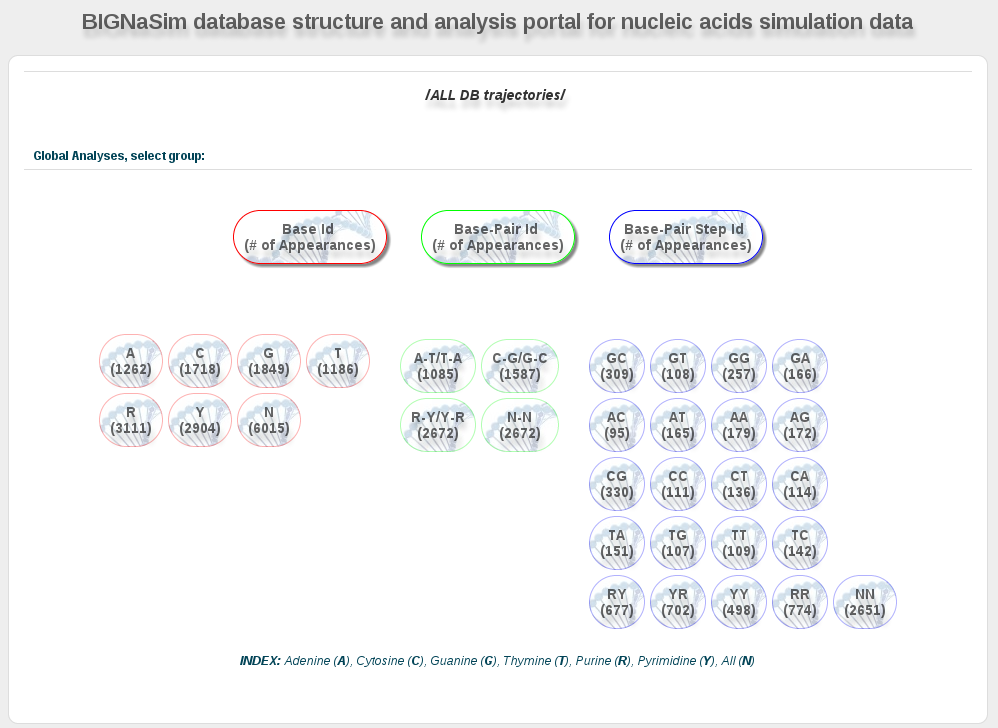
Clicking on one of the bullets will open a new section at the bottom of the page with all the analyses stored in the database for the particular code. As the analyses are defined in a hierarchical way, user must select the desired analysis at each step, until finding the final values. Final results are shown in different ways, depending on the analysis (histograms, average values, 2D plots, etc.).
As an example, if a user is interested in the Slide helical parameter values for the particular CG base-pair step, the steps to follow are described in the next figure: After clicking on the CG bullet, select Curves analysis, helical parameters, and finally Slide parameter.
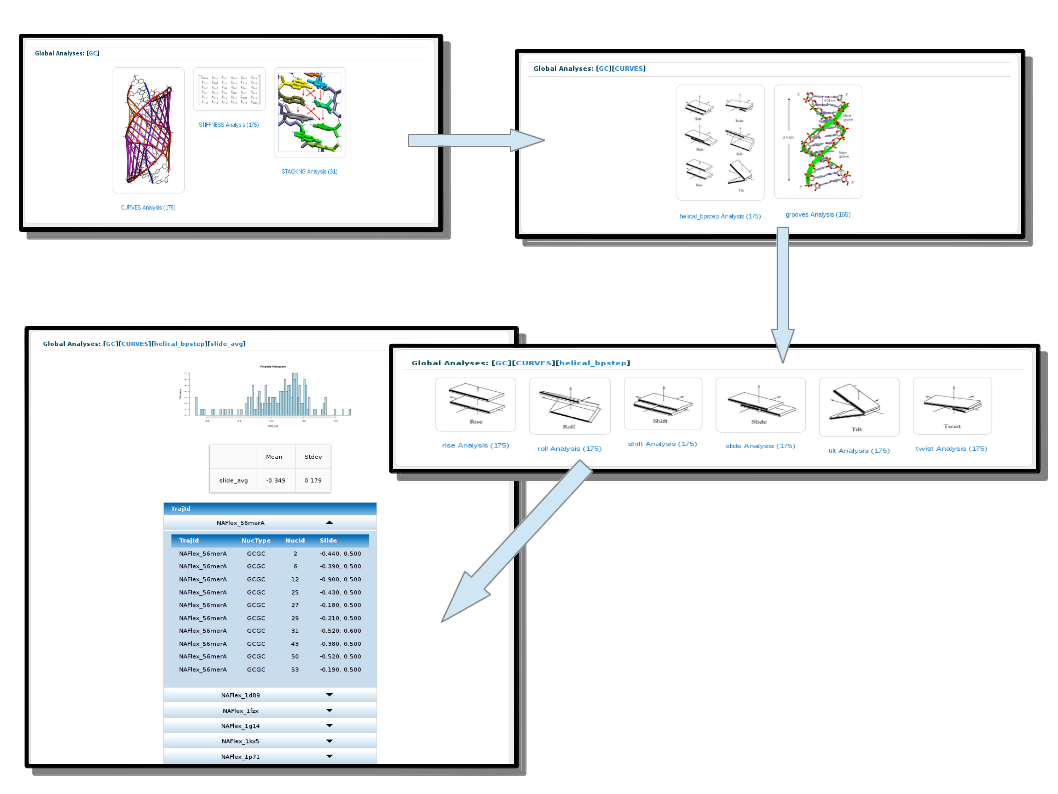
The values and plots for the final results depend on the type of analysis. Typically, a distribution is shown using the MD simulation time-averaged values for all the particular groups included in the system corresponding to the ones selected (e.g. CG base-pair step). When available, a vertical line is plotted together with the distribution histogram showing the experimental average value for the particular analysis (see Experimental Analyses section).
In analysis where resulting values are not just averages, as could be percentages or values per atom pairs, plots are represented accordingly (bar plots for percentages, boxplots for atom pairs).
Next to the generated plot, a table is shown containing all the values together with their corresponding simulation id, group (base/base-pair/base-pair step) and group number to be identified inside the particular MD simulation sequence.