Bioactive Conformational Ensemble Help - Subsets Clusters
Clusters
The Clusters tab presents the results of the clustering analysis of the lowest temperature/scaling factor trajectory, which generates the final set of selected conformers. The section is divided in 3 sub-sections, which can be selected in the top-right corner of the window:
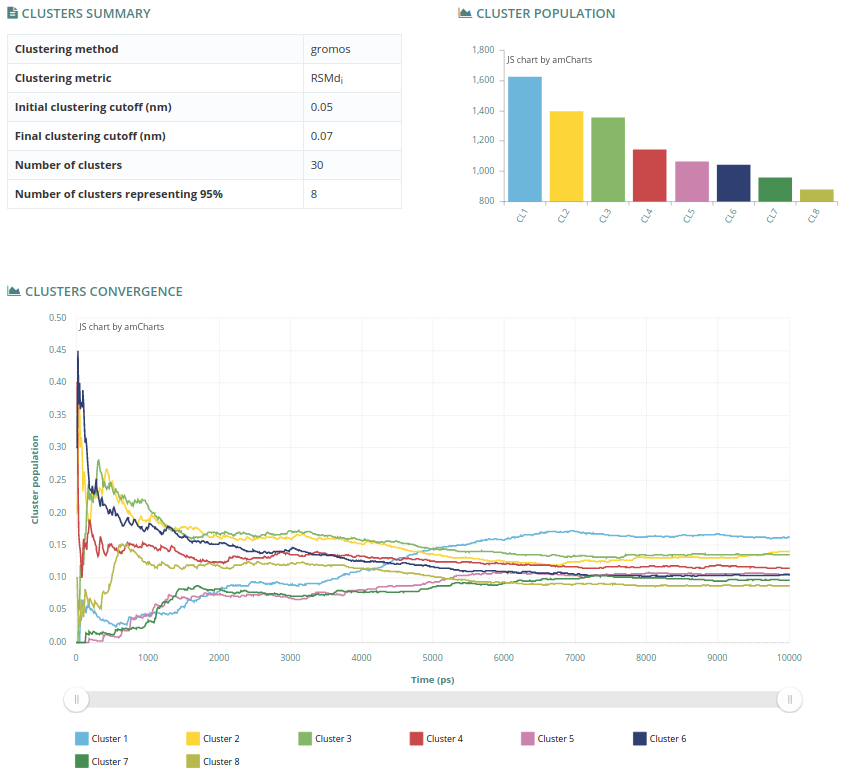
Summary
The summary section contains information about the clustering analysis (Clusters summary table, top left). The metric and the clustering method used, together with the initial and final cutoff of the iterative clustering procedure are shown (nm). From the total number of clusters found (Number of clusters), the final number of different representing conformers is adjusted to represent 95% of the variability of the computed trajectory (Number of clusters representing 95%).
The cluster population chart (top right) graphically displays the number of snapshots represented by each cluster. Finally, the clusters convergence plot (bottom), shows how this population changes along time.
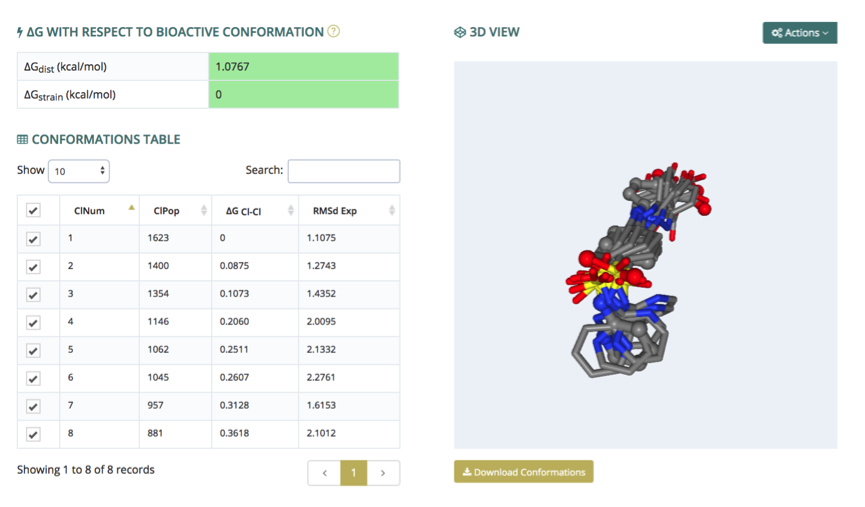
Conformations
The conformations section presents the 3D structures of each of the individual conformers, plus the experimental one (if available). The structures are rendered in an NGL interactive widget (3D view, right), where each conformer can be shown, hidden or compared with the others. Conformers to be represented are selected in the conformations table (left), which also contains associated information such as cluster population, RMSd of the cluster representative against the experimental structure (if available), and relative Gibbs free energies computed from the cluster population, always referred to the most stable cluster. When the bioactive conformation is known, the strain and distortion free energies obtained from the cluster populations (see references) are shown (ΔG with respect to bioactive conformation, top left).
The visualization window allows three different structure alignments: by heavy atoms, by biggest rings, and by Gaussian RMSd. Hydrogen atoms and experimental structure (if available) can be shown and hidden through a switch key. All these controllers are displayed from the top-right Actions button. Finally, the complete set of conformations can be downloaded, in multi-PDB format, from the Download Conformations button (bottom right).
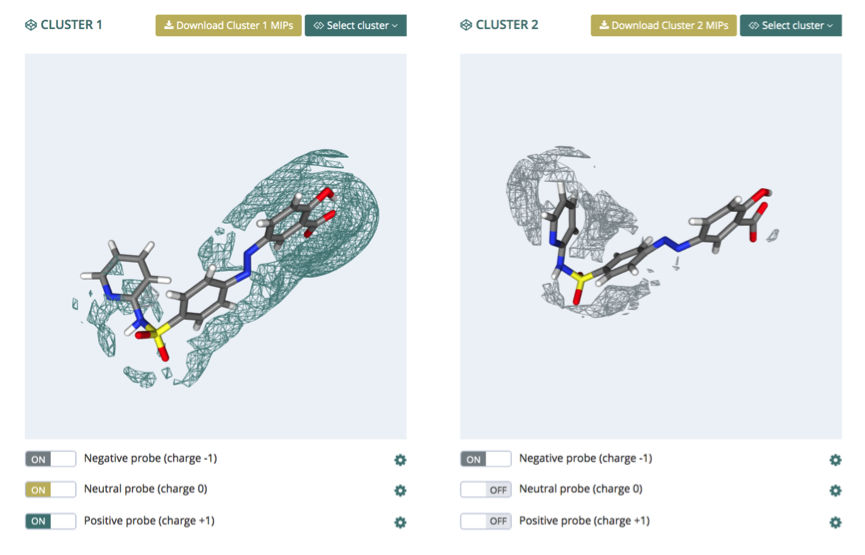
MIPS
The MIPS (Molecular Interaction Potentials) section presents the grids obtained by using three different MIP probes: positive, negative and neutral. NGL is used again to graphically and interactively show the structures and the associated energy grids. The interface represents two different conformers at the same time, so that they can be easily compared. The particular conformers to be compared can be selected from the Select Cluster button.
Each probe has an associated grid, which can be shown and hide from a switch button (bottom). Besides, a control panel can be expanded clicking at the cogwheel symbol, revealing three additional functions to be applied to the represented grid: level (energy cutoff), opacity (from 0 to 1) and representation (wire / solid surface).
Finally the computed grids for each conformer can be downloaded from the Download cluster MIPS buttons (top).