Bioactive Conformational Ensemble Help - Subsets Dihedrals
Dihedrals
The Dihedrals tab presents the behavior of all dihedral angles within the molecule along the simulation, useful to determine which torsions are contributing the most to define the molecular conformational space. The section is divided in 3 components:
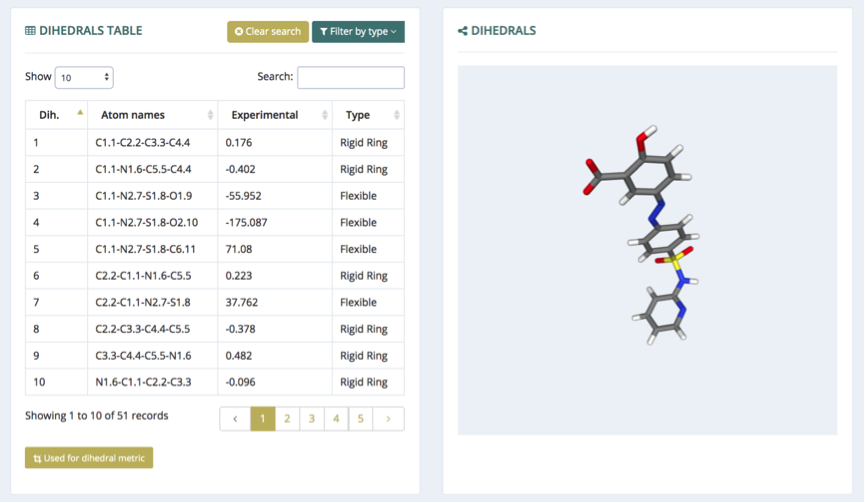
Dihedrals Table / 3D View
The whole set of dihedral angles from the small molecule are listed in the Dihedrals table (left). Each table row contains the atom codes forming the dihedral, the value of the particular dihedral angle in the experimental structure (if available), and the type of the dihedral, according to its flexibility in the simulation (Flexible, Flexible Ring, Rigid and Rigid Ring). The table can be filtered by one of these types, using the Filter by type button (top right).
The table has an associated window to visualize the 3D structure and easily identify the set of atoms forming a particular dihedral (Dihedrals 3D View, right). Table and visualizer are connected: hovering the mouse pointer on the table rows will automatically highlight the atoms of the dihedrals in the visualizer, and vice-versa, clicking on a particular bond in the 3D structure representation will automatically highlight the corresponding dihedral entry in the table.
Finally, the set of dihedral angles used for the clustering post-processing (if applicable, see references) can be highlighted in the table just clicking at the Used for dihedral metric button (bottom).
Clicking at one particular dihedral from the table (table row), the complete set of dihedral angle values extracted from the MD trajectory is represented in the Dihedrals Histogram component (see next section).
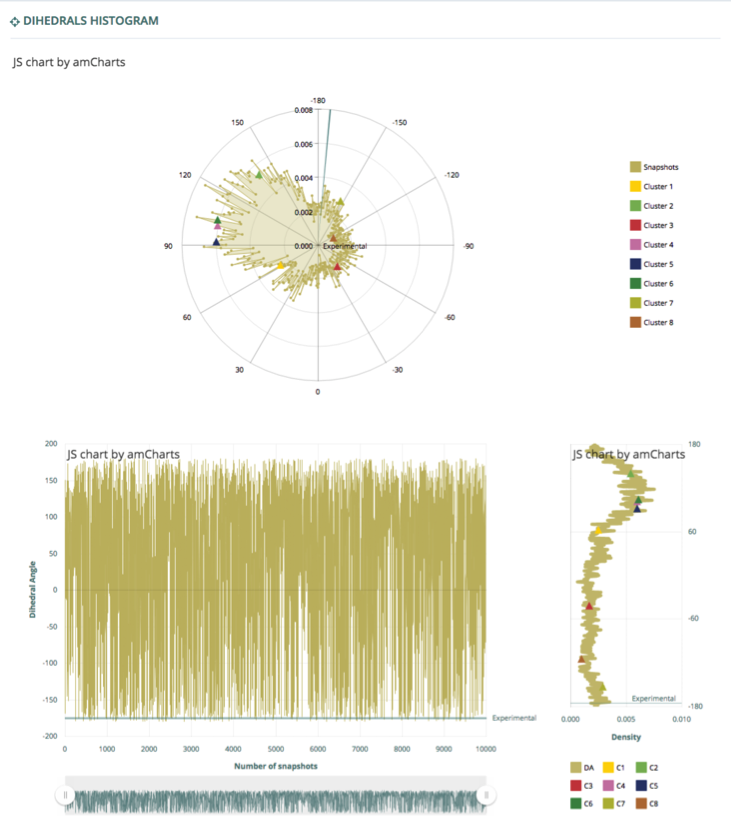
Dihedrals Histogram
The Dihedrals Histogram component shows three different plots representing all the values collected for a particular dihedral angle from the MD trajectory. The first one (top) is a polar chart displaying the distribution of the angle values [-180,180º] from all the snapshots of the simulation, with the dihedral values corresponding to the different cluster conformations represented on top, and the one from the experimental structure (if available), represented as a green line.
The two charts in the bottom of the component show all the dihedral angle values [-180,180º] for all the snapshots along the trajectory, and its associated histogram (right-hand side). Similarly to the previous plot, the different cluster conformations are represented on top of the histogram, and the one from the experimental structure (if available), is represented as a green line.
The chart presenting the results is interactive: it can be zoomed in/out and the values visualized can be shown/hidden clicking at the corresponding legend square boxes. A time slider is added to reduce the window time and can be then used to scroll the desired time-window left and right (see https://www.youtube.com/watch?v=oRjytvcWrWw for a real-time example). Placing the mouse pointer on the chart lines will automatically show the analysis values for the particular time point.