Bioactive Conformational Ensemble Help - Subsets PCA
PCA
The PCA (Principal Component Analysis) tab shows global information on the molecule flexibility extracted by means of essential dynamics, following the statistical procedure of PCA dimensionality reduction, which extracts orthogonal movements describing the variance of the system by diagonalization of the covariance matrix. The section is divided in 4 components:
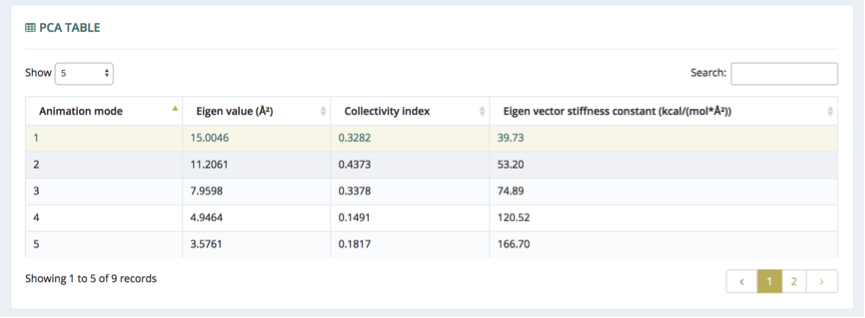
PCA Table
The table on the top of the page presents useful information about the principal components (modes). The number of modes is selected to represent a 90% of the trajectory variance, and vary depending on the molecule. The eigenvectors, which describe the nature of the deformation movements of the protein, appear ranked, with the first one being the one explaining the largest part of the variance (as indicated by the associated eigenvalue). Since the eigenvectors represent a full-basis set, the original Cartesian trajectory can be always projected into the eigenvectors space, without lost of information. The table contains, for each of the eigenvectors (the modes or the principal components): the set of eigenvalues, which indicate the stiffness associated to every mode (Å2); collectivity index, which measures how many atoms are affected by a given mode; eigen vector stiffness constant, which is the associated force constant of the particular mode according to its eigen value (kcal/mol*Å2). The rows of the table are interactive. When clicked, information associated to the particular mode is being cast to the following components (3D View / Fluctuation).
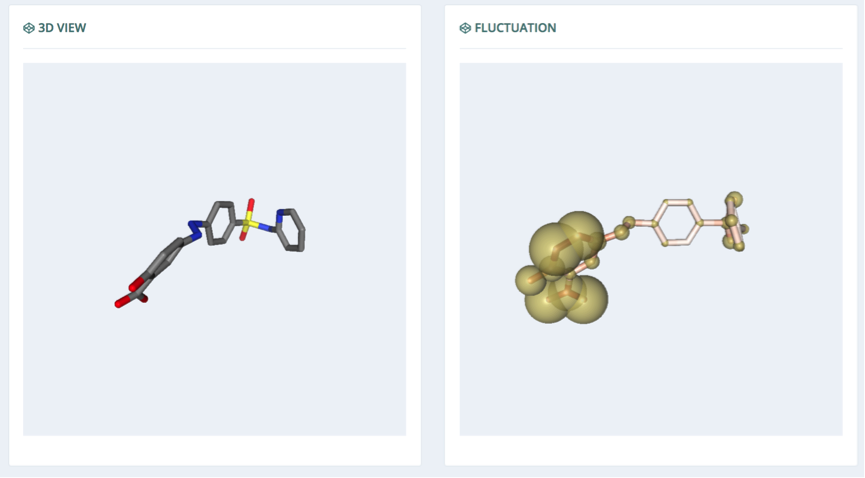
3D View / Fluctuation
The 3D components in this section show the projection of the global movement of the molecule through the particular mode selected in the table (left) and the atomic fluctuation (right). The radius of the sphere representing the atoms in the fluctuation display is correlated with the fluctuation: the bigger the sphere, the higher the fluctuation of this particular atom in the corresponding mode.
To ease the 3D-structure inspection, the visualization windows are interconnected: if one of the molecules is rotated or zoomed, the other window will automatically follow the same rotation/zoom.
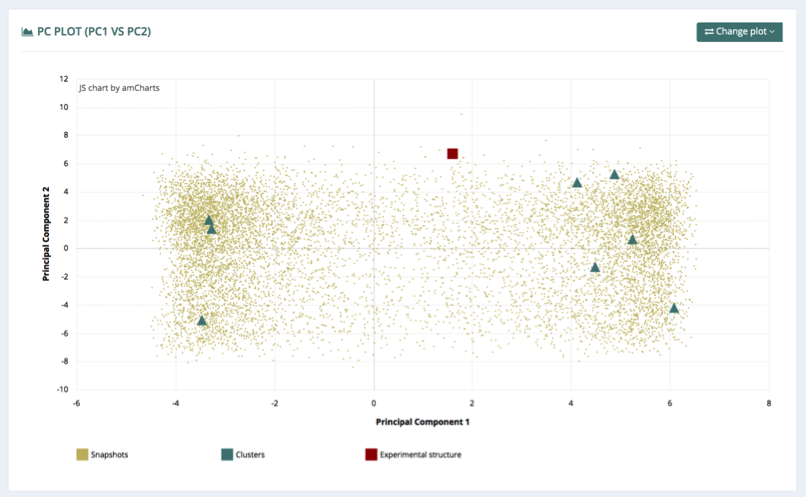
PC Plot
The principal components plot (PC Plot) represents the projections of all the snapshots, representative clusters and experimental structure (if applicable) of the trajectory onto the first principal components. Three different plots are available, selectable from the top-right button (Change plot): 1st vs 2nd, 1st vs 3rd, and 2nd vs 3rd principal components projections. The distribution of the cluster points indicates how well they describe the global movements of the molecule according to its principal components.